vibration limits
vibration limits – Introduction
This article talks about Vibration Limits, in machines, according to various criteria.
This article is part of a series of articles included in support of Course on Vibration Limits
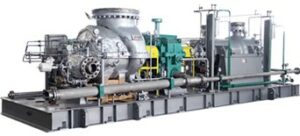
When it takes placevibration analysis gears, in a vibration analyzer when performingpredictive maintenance, commonvibration analyzer This article presents the vibration limits in rotary-dynamic pumps as defined in the ISO series of standards..
The values measured by the instrumentation are evaluated based on criteria and limits to verify the condition of the machine. Monitoring systems and data collection equipment can automatically evaluate data based on measured values.
Global measurement levels are usually evaluated in terms of limits; ex., acceptance of new and repaired equipment, normal, surveillance and stop. These levels are compared over time in order to establish trends.. Measurement levels can be expressed as global vibration values – peak or peak to peak; the rotor position, the peak frequency component of the vibration, and the overall vibration or mean square value (rms) band.
The measurement used should be based on the sensitivity of the machine – i.e., the greatest change in the level of a measure, such as the speed of vibration, must be obtained for a change in machine condition.
Effective velocity is normally used to measure vibration in bearing housings because it contains both displacement and frequency., simultaneously and it is, therefore, a measure of fatigue. Besides that, speed is the dominant parameter in the frequency range of 10 Hz a 1000 Hz at which most machine vibrations occur.
Displacement is a good measure for machines with oil film bearings because it directly determines the amount of play in the bearing used by vibration..
Acceleration is used to measure fault indicators that manifest themselves at high frequencies., such as bearing degradation.
Spectrum is used when detail is desired., mostly for surveillance. Each line of a spectrum is compared, by computer or manually, with a standard or with initial reference data. Automatic monitoring systems can compare spectral shapes point by point and global measurements with baseline data or standards data.
Usually one or more vibration measurements are monitored. (relative displacement, speed or acceleration), depending on machine design. Factors related to machine design and operating characteristics that influence machine condition include rotor speed and fatigue strength.
vibration limits – The diversity of machines
The loads on the machine should also influence the levels of vibrations and, therefore, must be considered.
The diversity of machine design, installation and operating conditions made it impossible to develop absolute standards, levels, and guidelines that can be used in conjunction with monitoring systems to protect machines. Therefore, although systems that monitor machine condition can collect accurate data very quickly, these data are of value for comparison and interpretation only if criteria and limits have been developed for a class of machines or for a single machine during operation.
Yet, general guidelines are available, that can be used to develop criteria and limits. This chapter deals with currently available guidelines and techniques for developing criteria and limits for specific machines..
vibration limits – Relative and absolute vibrations
Guidelines for acceptable vibration levels are based on relative vibration measurements in the shaft absolute vibration measurements in the bearing housing.
Relative shaft vibration is used to assess the condition of a machine with relatively large bearing movements and a high casing weight to rotor weight ratio.. Machines with anti-friction metal bearings are included; exceptions are centrifugal pumps and some generators.
Absolute vibrations in the bearing cover and housing are used in a condition monitoring program to evaluate machines with rigid bearings.
ISO standardization on vibration limits (relative and absolute) for specific machines
Here you can see a video on this topic, “Machine vibration limits – a history of normalization”.
There are numerous ISO standards on specific machines, among which those shown in the table below stand out..
ISO standard table for evaluating relative and absolute vibrations in machines
| machine type | standard number | Description |
| General | ISO 20816-1:2016 | Mechanical vibration — Measuring and evaluating machine vibration — Part 1: General guidelines |
| Generator sets running at 1500, 1800, 3000 e 3600 RPM | ISO 20816-2:2017 | Mechanical vibration — Measuring and evaluating machine vibration — Part 2: land gas turbines, steam turbines and generators of more than 40 MW, with anti-friction metal bearings and rated speeds of 1 500 rpm, 1 800 rpm, 3 000 r / min e 3 600 rpm |
| General | ISO 20816-3:2022 | Mechanical vibration — Measuring and evaluating machine vibration — Part 3: Industrial machines with power above 15 kW and operating speeds between 120 r / min e 30 000 rpm |
| Gas turbines with more than 3 MW | ISO 20816-4:2018 | Mechanical vibration — Measuring and evaluating machine vibration — Part 4: Gas turbines above 3 MW, with anti-friction metal bearings |
| Generator sets for hydroelectric power plants | ISO 20816-5:2018 | Mechanical vibration — Measuring and evaluating machine vibration — Part 5: Machine sets in hydraulic power generation plants and pump storage |
| alternative engines | ISO 10816-6 :1995 | mechanical vibration – assessment of machine vibration through measurements on non-rotating parts – part 6: alternative machines with power above 100 kw |
| dynamic rotary pumps | ISO 10816-7:2009 | Mechanical vibration — Evaluation of machine vibration by measurements on non-rotating parts — Part 7: Dynamic Roto pumps for industrial applications, including measurements on rotary axes |
| Reciprocating compressors | ISO 20816-8:2018 | Mechanical vibration — Measuring and evaluating machine vibration — Part 8: Alternative compressor systems |
| gears | ISO 20816-9:2020 | Mechanical vibration — Measuring and evaluating machine vibration — Part 9: gears |
| Horizontal wind turbines with gears | ISO 10816-21:2015 | Mechanical vibration — Evaluation of machine vibration by measurements on non-rotating parts — Part 21: Horizontal wind turbines with gears |
| fans | ISO 14694: 2003 | General purpose fans - Part 7: This article presents the vibration limits in fans as defined in the ISO standard. |
Each of them deserves a careful reading..
As an example below, you can see the effective speed criterion measured in the bearing boxes, withdrawn from ISO 20816-3:2022.
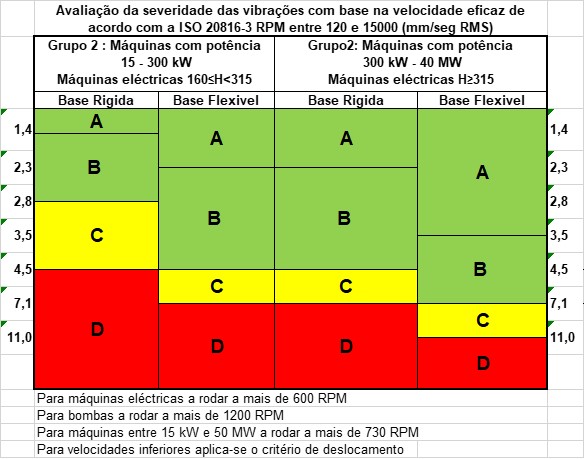
the letters A, B, C and D represent vibration quality grades, ranging from good (A) the unacceptable (D).
vibration limits – Types of evaluation criteria
There are two main types of evaluation criteria:
- Vibration level under stable operating conditions
- Change in vibration level
The latter is the most reliable when it comes to implementing predictive maintenance programs with vibration measurement..
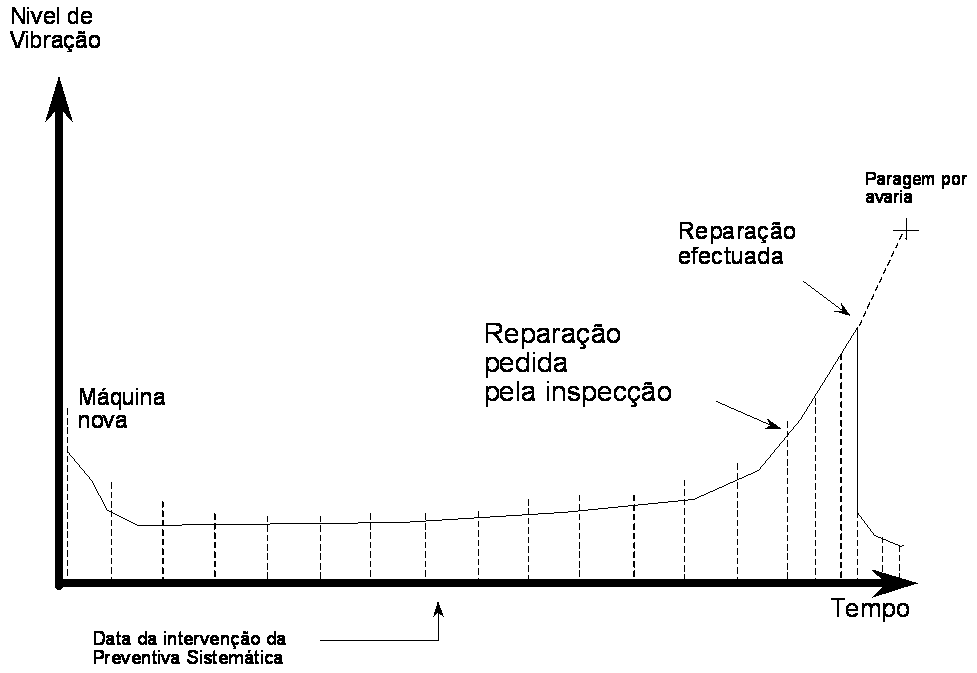
Figure - Evaluation of machine condition by change in vibration level
The specific features of anti-friction metal bearings
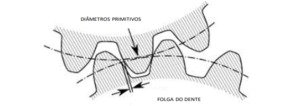
Features of anti-friction metal bearings, such as diametral clearance are also important. The eccentricity is the distance between the center of the shaft in operation and the geometric center of the bearing..
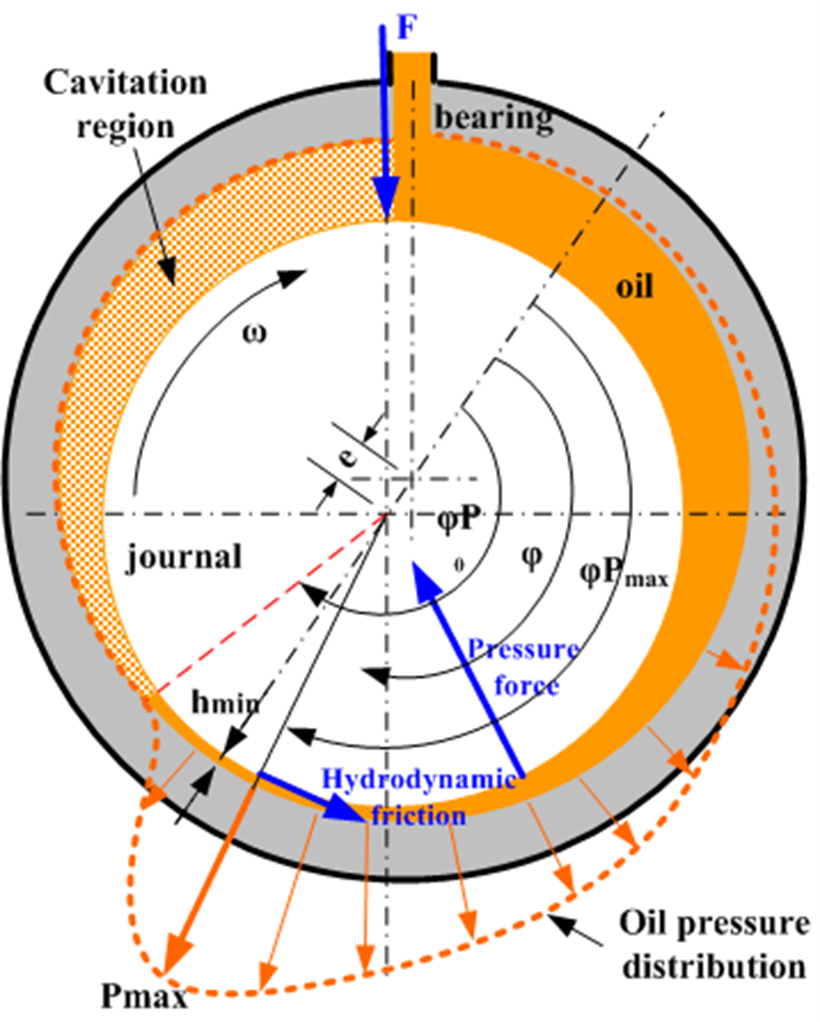
Figure – Geometry of an anti-friction metal bearing
The eccentricity ratio determines where the journal operates in the bearing. (the eccentricity ratio in the ratio between the distance between the centerline of the journal and the centerline of the bearing and the radial clearance as shown in the previous figure.
However, both can be rigid, whether they are roller bearings or anti-friction metal, and its flexibility with respect to the rest of the machine is important.
vibration limits – Other criteria – relative vibrations
Shaft vibration is measured with proximity sensors in the bearings or as close as possible. Such measurements are useful if the relative motion has adequate sensitivity.. A machine with bearings is not sensitive enough.
If two proximity probes are used in one bearing, an orbit of its movement can be obtained, as well as the position of the journal inside the bearing, while the machine is in operation. Proximity sensor measurements establish the shaft balance position. The dynamic signal provides the position at every instant. From this information, can be done directly from the measurements, an accurate assessment of bearing condition.
A guideline for evaluating shaft vibration based on bearing measurements is shown in the following figure.. Normal limits are given, surveillance and stop.
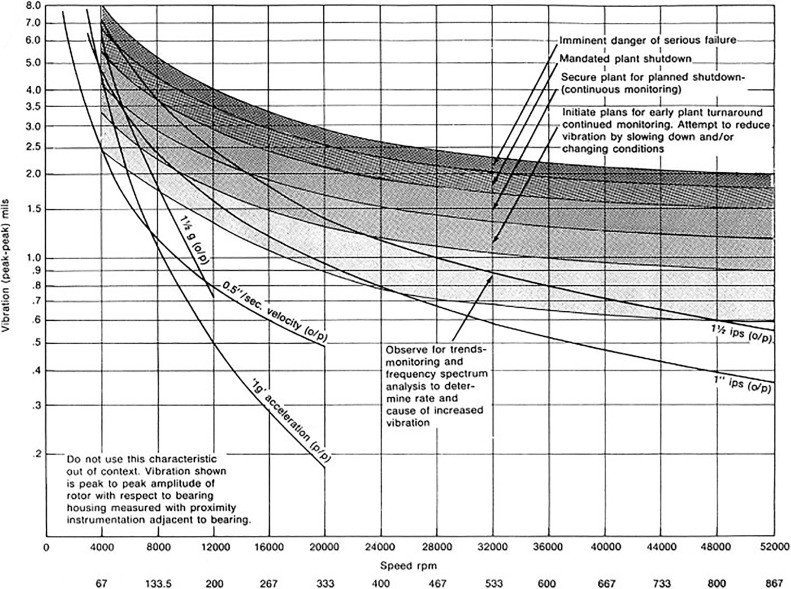
Figure – Dresser-Clark diagram for measuring relative shaft vibration on turbo machines with proximity probes
vibration limits – Relative vibrations and bearing play
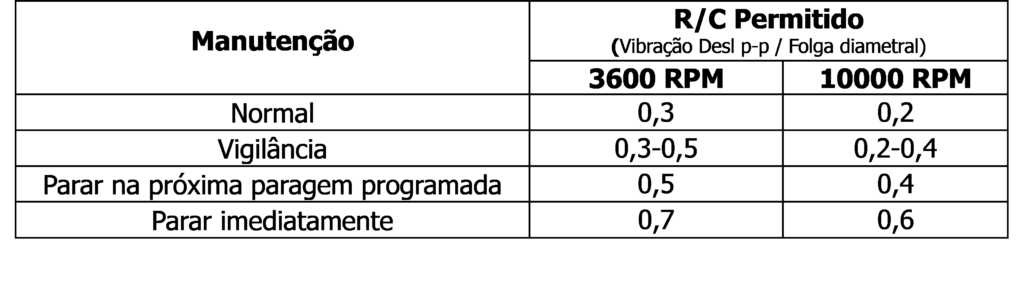
A widely used method of evaluating journal vibration in a sliding bearing is to compare relative rotor vibration with bearing clearance.. The following table lists the journal clearance, the rotor speed, and the relative vibration for recommended maintenance actions. The R/C ratio of the measured relative vibration R (in µms peak to peak) and the diametral clearance C (in µms peak to peak) of the bearing is calculated and identified in the following table in accordance with the speed of the machine. The diametral clearance is the difference between the bearing diameter and the shaft journal diameter..
Table – Evaluation of rotor/bearing vibration
Other criteria – absolute vibe
On machines with roller bearings, vibratory forces are transmitted to the housing through the bearings. Vibration measurements should be made on the bearing housings, as close to the bearing as possible. To measure vibration, velocity transducers or accelerometers must be used.. The type of measurement made is dependent on the design and operating conditions of the machine..
Modified Blake diagram
Limits are based on peak or rms measurement and are designed for the vibration component at one RPM.
A modified Blake diagram, shown to follow, is related to the overall vibration adjusted with a service factor, in order to obtain the effective displacement, the velocity, or the acceleration. Peak vibration in the bearing housing must be measured using the waveform or a peak measurement system.. Note that the horizontal and vertical axes have a logarithmic scale.. These are used to compress the scales so that the full range of data can be applied to a single diagram.. In this case, data can be evaluated from 0,25 mm/s até 250mm/s, with the appropriate dynamic range of variation. Note should be taken of the speed and type of machine.
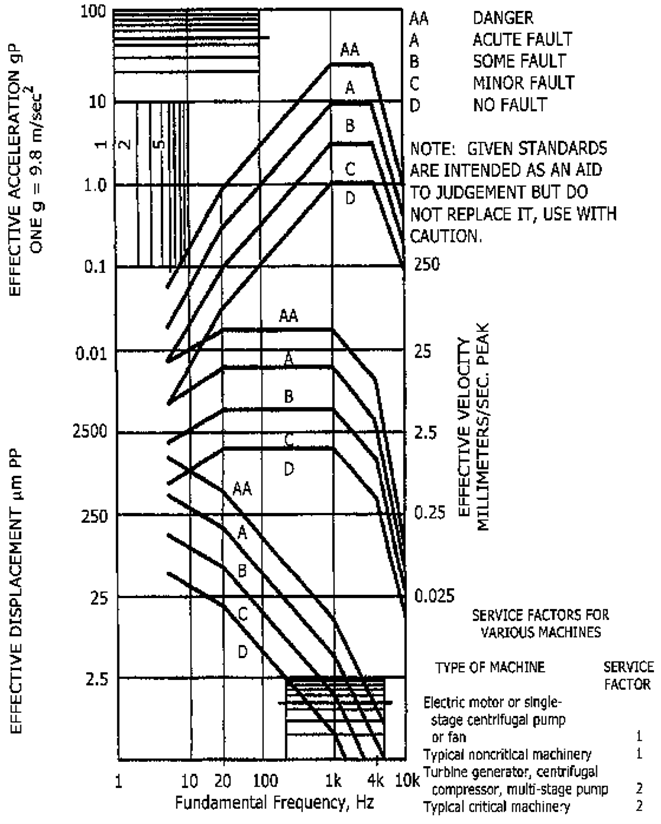
Figure Modified Blake Diagram for Peak Vibration Limits in Bearing Cover
The vibration level is applied to the previous figure, at the appropriate speed to obtain machine condition. For example, a generator with a vibration measurement of 3,75 mm/s falls into the “Some Fault” region of the map. The recommended maintenance actions in the following table for peak speed or rms values are based on field data.
Vibration limits table according to modified Blake diagram*

*These values should be adjusted to reflect the condition of the machine..
Service factors may be required for some special equipment, depending on the project, speed and/or process.
General rules have been established that use a service factor to evaluate once-per-revolution type failures.. These rules are based on the peak vibration velocity measured in the frame.. The guidance rules have been tailored by comparing data measured on specific machines with known issues to the levels given in the rules.. In subsequent measurements the effective vibration evaluated in the rules is obtained by multiplying the measured vibration by the service factor.
When the service factor is unknown use:
- 1.0 for various machines,
- 2 or 3 for critical machines,
- 0.5 for non-critical machines.
For example, if they were considered satisfactory 7,5 mm/s for a rotary fan, a service factor of 5/7.5=0.667 would be established for the Blake diagram. Service factors cannot be established based on just one measurement. A statistical sample of the relationship between machine condition and measured vibration is required.
additional method – Frequencies and vibration vectors
Broadband vibration evaluation criteria are often used without reference to frequency or phase components.. That is, in most cases, suitable for acceptance testing and operational monitoring purposes. However, in some cases, the use of vector information for evaluating vibration in certain types of machines may be desirable.
Information about vector changes is particularly useful in detecting and defining changes in the dynamic state of a machine.. In some cases, these changes went unnoticed when using broadband vibration measurements.
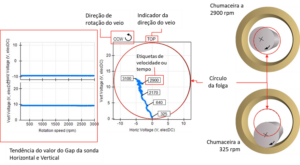
In the following figure, you can see the evolution of the amplitude and phase of the component at 1x RPM of a multi-stage pump, high pressure, boiler feed water, between November of one year and May of the following year. It can be seen in the lower right image that the peak amplitude at rotational speed was not stationary and that it decreases from the first measurement.. Also the phase was variable (top right image) leading to a different vector (left image) at every start of the machine. This variability was a symptom that the main axis of inertia was shifting in position between each start, being a symptom of loose mass, i.e. an awakening. In this case, later it was identified that an impeller was loose.
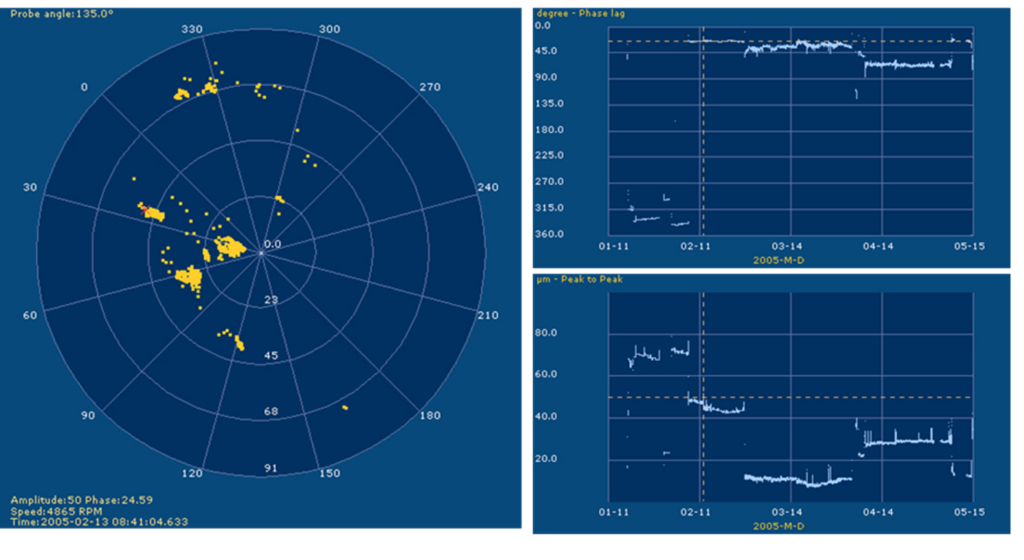
In the previous figure it can be seen that in some situations the amplitude of vibrations in peak-peak displacement decreases, not indicating the seriousness of the problem.
additional method – Techniques for evaluating bearing vibrations
There are alternative approaches beyond broadband vibration measurements, to assess the condition of the bearings, like the HFD, the measurement of shock impulses or the analysis of the envelope. Each of these techniques has different evaluation criteria..
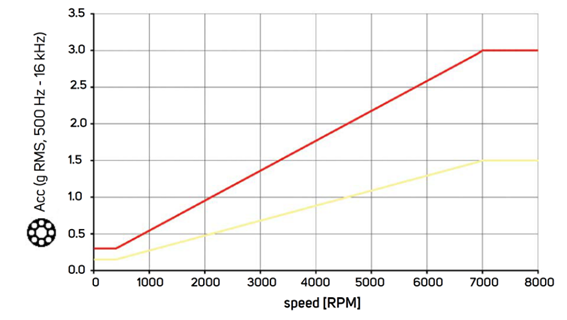
Using a simple broadband measurement technique on raw bearing acceleration data, often provides enough information to give guidance on operating conditions. This simple technique is not successful in all circumstances.. In particular, Errors in the evaluation can arise if there are significant errors due to resonance effects in the bearing or its housing within the measuring frequency range, or if there are vibrations from other sources that are transmitted to the bearing cage being evaluated, such as gear vibrations.
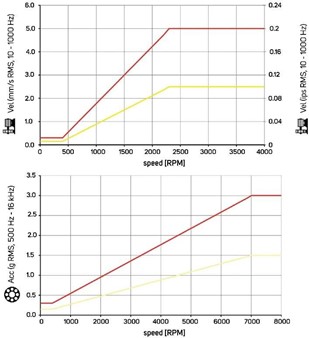
As an example below, you can see a graph for evaluating rms acceleration, me g, between 500 Hz and 16 KHz from the manufacturer ADASH.