Turbomachinery and Polar diagram
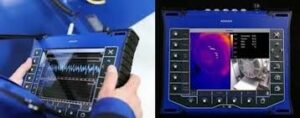
An important measurement made using the order-following capabilities of Vibration analyzers is the one of turbomachinery starts and stops and polar diagram.
This article belongs to a series, which constitutes the support material for the course on vibration analysis in turbomachinery. Links to the other articles can be found on here.
why is it important when looking at speed variation in a machine (or of Nyquist)
Polar diagram is a common method of displaying transient data. Typically exhibit synchronous vibration (However, data at nX RPM can also be displayed) and corresponding phase, versus rotation speed.
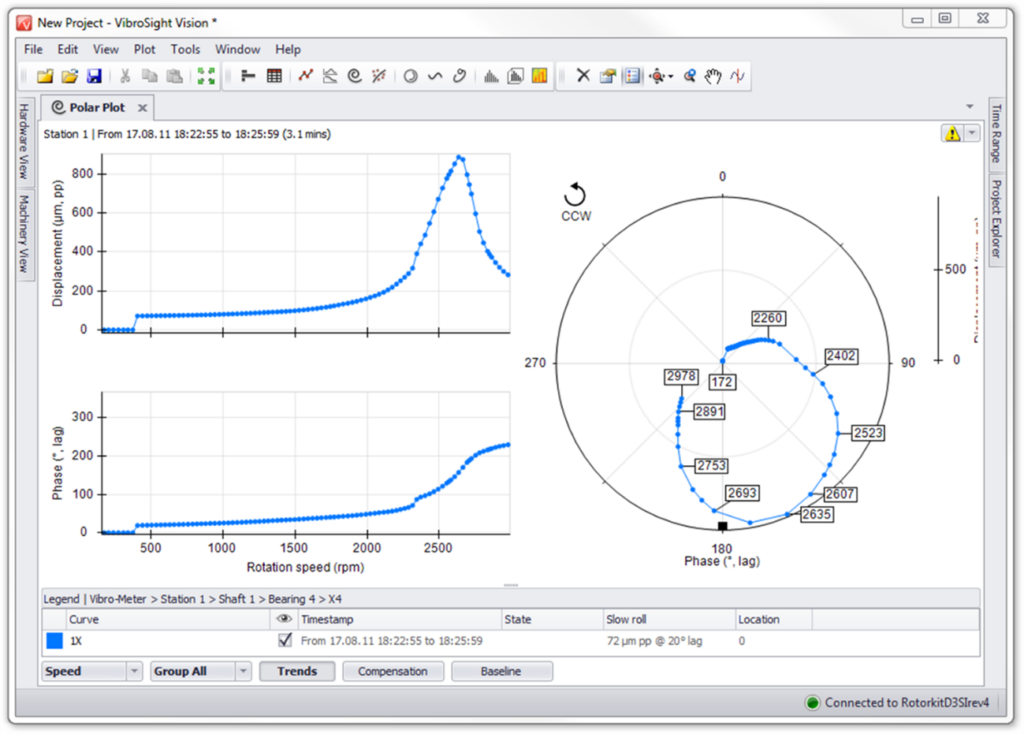
Turbomachinery and Polar diagram – Figure 1– The Bode Diagram of starting a machine, accompanied by the respective Polar diagram, showing the critical speeds.
The polar graph displays exactly the same data as the Bode chart, just in a different display format. in the polar chart, the magnitude of the displacement vector is measured radially, from the center of the graph, and the phase is represented circumferentially. A resonance is indicated on a polar graph by the speed at which the amplitude is a maximum of one turn. (that is, approximately 180 degrees of phase change).
Sometimes, polar plots make it easy to determine when the rotor has crossed its critical speed, because the phase change is obvious (that is, to each 180 degrees on the graph).
The natural frequencies of the rotor can be determined by locating the peak in the vibration amplitude that also corresponds to a phase shift of approx. 180 degrees.
Turbomachinery and Polar diagram – interpretation of a polar diagram
The following figure describes the meaning of the different information presented in a Polar diagram..
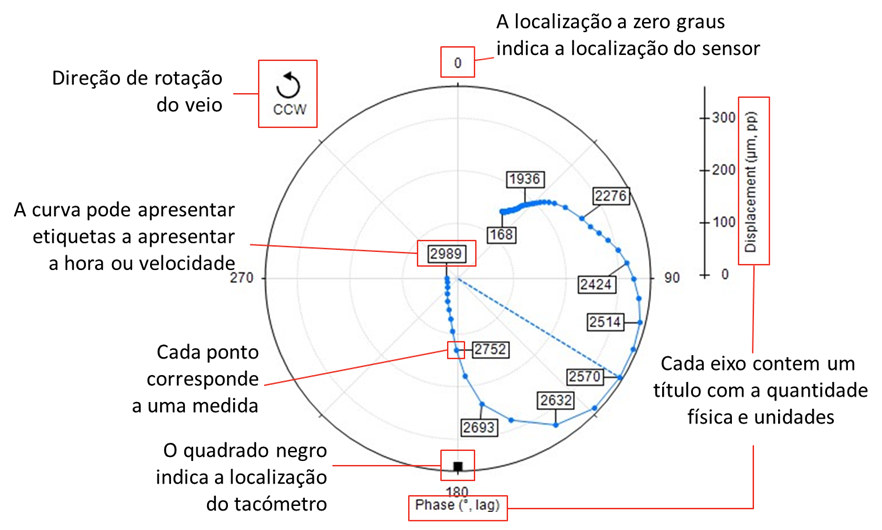
Turbomachinery and Polar diagram - Figure 2- Description of the meaning of the different information presented in a Polar diagram
The polar graph can be compensated for eccentricity (relative vibrations). All areas where proximitor measures have a certain amount of physical and/or electrical deviation. The vector data is corrected for this eccentricity by vectorally subtracting the vibration vector at very low rpm from all the vector data obtained..
Below you can see a video on this topic..
Turbomachinery and Polar diagram -Identification of critical speeds
In the Polar diagram the critical velocity is identified by the maximum peak and the 180º phase shift.
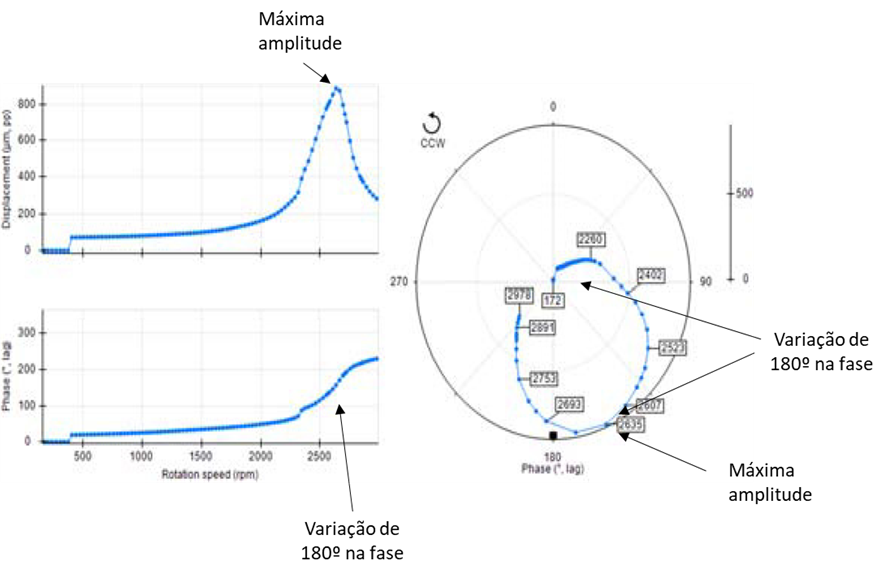
Turbomachinery and Polar diagram - Figure 3- In the Polar diagram the critical velocity is identified by the maximum peak and the 180º phase shift
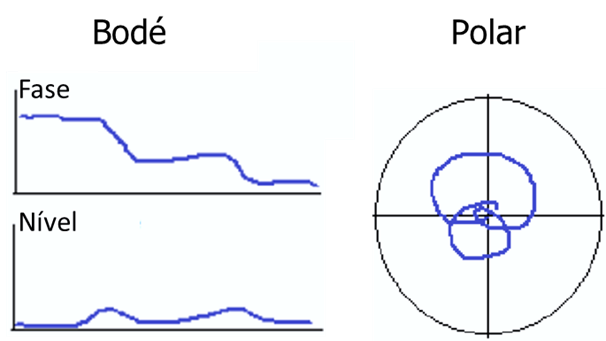
Not Polar Diagram:
- The resonances (rotor and structural) appear as loops;
- Same peak amplitude and phase shift as 90 degrees than the Bode plot
- Lap is easier to identify than Bode chart activity
- Structural resonances appear as small internal loops
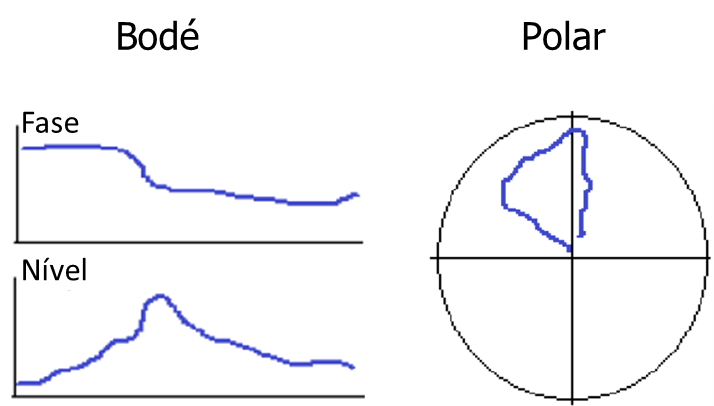
Turbomachinery and Polar diagram – the ideal situation
As a group of flexible rotors increases in speed, the rate of increase in the amplitude of the radial deflection, in conjunction with changing the phase angle, indicates how much of the observed vibration amplitude is due to static bending and how much is additionally induced elastic deflection or the associated respective mode of vibration.
not ideal case, the amplitude should remain flat or with very little response throughout the entire speed range and undergoing a phase angle change at any critical speeds as seen in the graphs below.
Turbomachinery and Polar diagram - Figure 4
Turbomachinery and Polar diagram – The imbalance
On a Bode graph, the most important identifier of the presence of imbalance is the slope pattern of amplitude in proportion to velocity, in combination with the presence or absence of radial phase angle shift.
Turbomachinery and Polar diagram - Figure 5
On a corresponding polar graph, the most important identifier of the presence of an imbalance is the presence of any straight data section on the graph. A straight line on a Polar graph can occur along a variable speed or at a constant speed, and can be at a constant phase angle (pointing out “out”), or appear along phase angles.
Turbomachinery and Polar diagram – Run out, warping and misalignment
If the amplitude at low speed is already different from zero, this is indicative of a rotor warp or imbalance, and is also often proportional to rotor stiffness.
A non-zero amplitude from a low speed and staying flat, and without any phase angle shift, suggests the presence of some run-out or warping, or the existence of a possible “crank effect”, on the rotor set due to an eccentric journal or a non-concentric coupling as seen in the following graphs.
Turbomachinery and Polar diagram - Figure 6
An initial increase in amplitude with no noticeable change in phase suggests pure rotor warping or imbalance being driven by centrifugal force., one orbit of the shaft in the bearing, of increasing amplitude, below the beginning of the first critical velocity region as seen in the graphs below.
Turbomachinery and Polar diagram - Figure 7
This is the condition where the rotor is being forced to go through a motion, not concentric, with its geometric axis.
If the amplitude continues to increase while the phase angle starts to change, this indicates that a dynamic component/shape of vibration is being added to the gyratory motion as seen in the graph below. If the total phase angle shift is notably less than 180 degrees, this indicates that the amplitude of the orbit of the shaft in the bearing is dominant over any elastic deflection associated with the respective mode of vibration.
Turbomachinery and Polar diagram - Figure 8
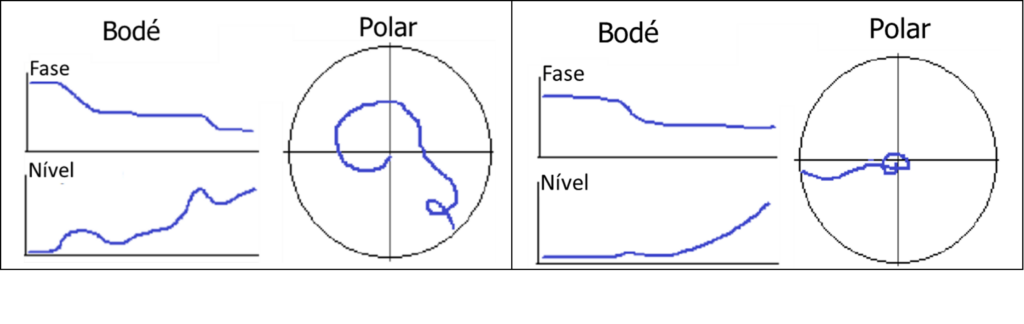
The influence of the behavior of other coupled rotors
If the phase angle shifts 180 degrees, with minimal change in the range of displacement, this suggests that the rotor driven by a neighboring rotor, which passes through its critical velocity region as seen in the graphs below.

Turbomachinery and Polar diagram - Figure 9
Similarly, one “boss” of the Bodé plot on the amplitude of the displacement without a phase shift can also come from the response of a neighboring rotor.
Such situations are readily evaluated by reviewing the specific velocity range of the amplitude and phase responses in the Bodé plots of all rotors..
In cases like this, it is very useful to have a Finite Element model of the rotors to identify the inherent natural frequencies of each rotor.
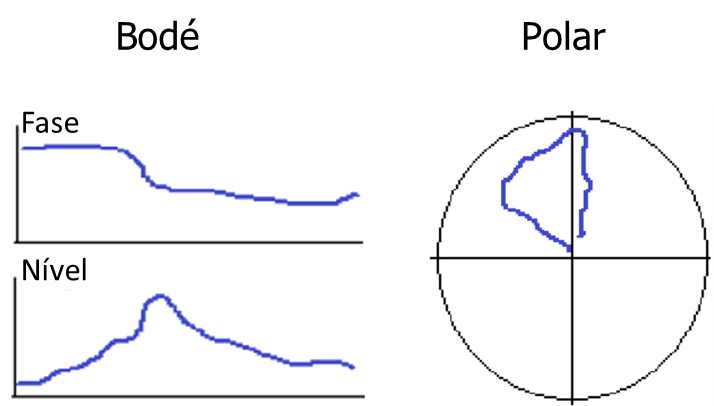
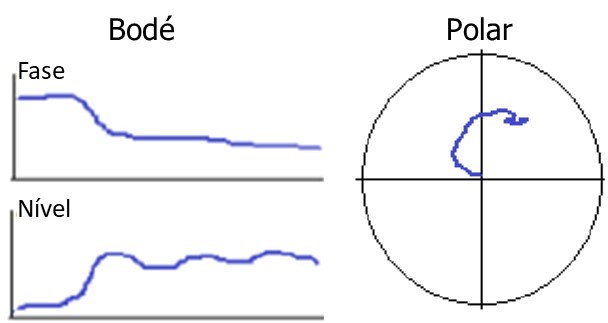
Rotor oscillation movement – axial asymmetry in the distribution of eccentricity
At speeds above the first critical speed, an upward amplitude trend without any noticeable phase angle change is an immediate indication of axial asymmetry in the eccentricity distribution that generates the oscillation/pivot mode as seen in the graphs below.
Turbomachinery and Polar diagram - Figure 10
Sometimes, an additional amplitude response is observed with a phase angle shift superimposed on the upward trend which is indicative of a resonant response at the second critical speed, as seen in the above graph (on the right side).
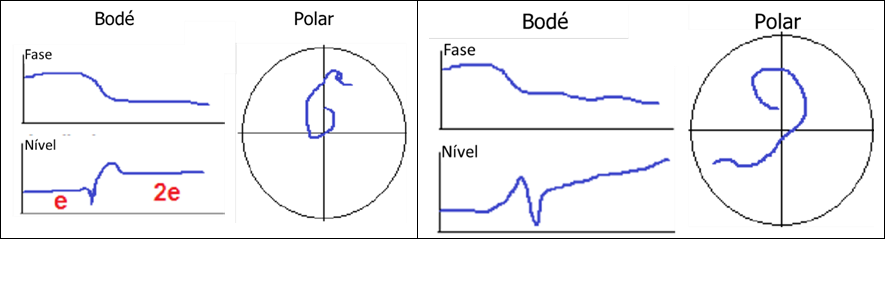
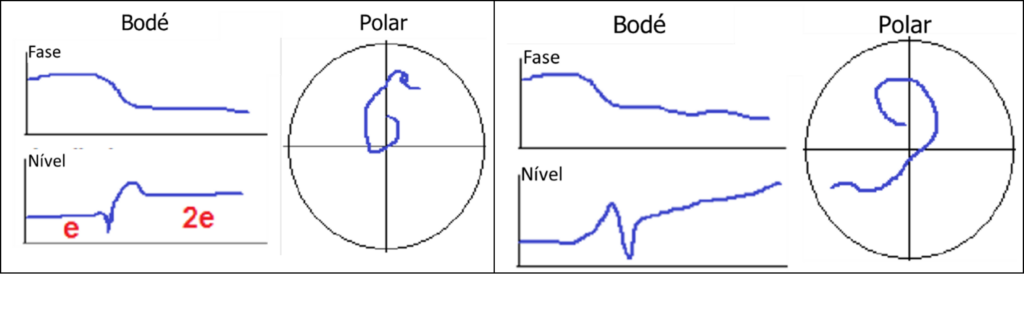
Turbomachinery and Polar diagram – Eccentricity
Another common indication of eccentricity is when the amplitude above the first critical velocity is approximately twice that measured below the first critical velocity., or just stay high, but somewhat flat as seen in the following graphs.
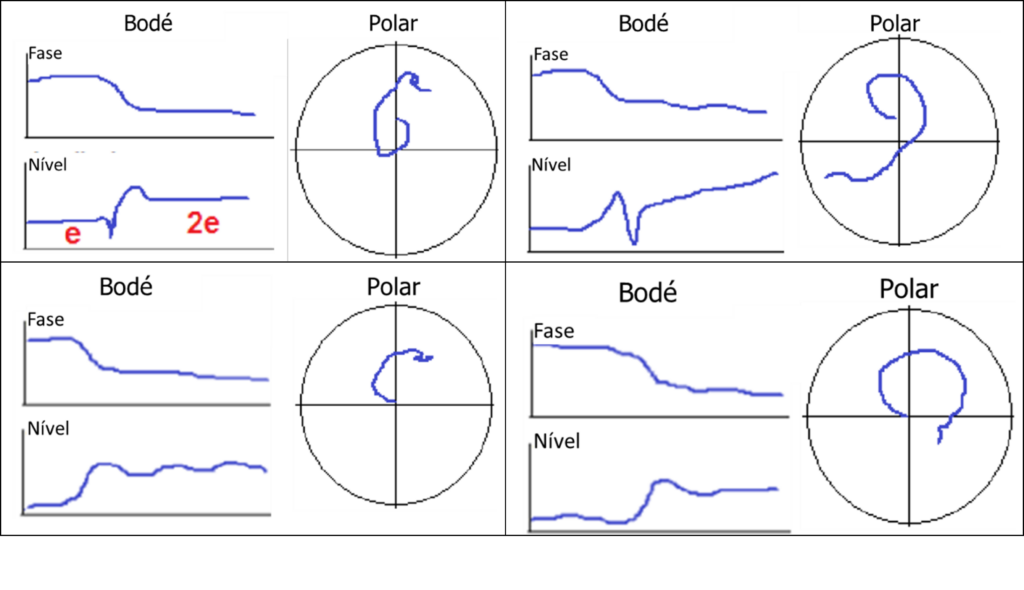
Turbomachinery and Polar diagram - Figure 11
This is a function of the rotor changing the position of its axis of rotation as it passes through the critical speed region.. At lower speeds, the sensors measure the direct amount of eccentricity of the mass axis rotating about the axis of the geometric, indicating an amplitude equal to the eccentricity, e. When the rotor is flexible enough, a reduced amplitude at the journal can be measured, since the rotor can mainly “oscillate” or flex in your medium plane, absorbing most of the corresponding force.
At higher speeds, the sensors come “whole rotor” rotating about the axis of inertia while continuing to rotate, such that the sensors measure the intrinsic eccentricity, as well as the measure of the eccentricity, indicating a range of 2e.
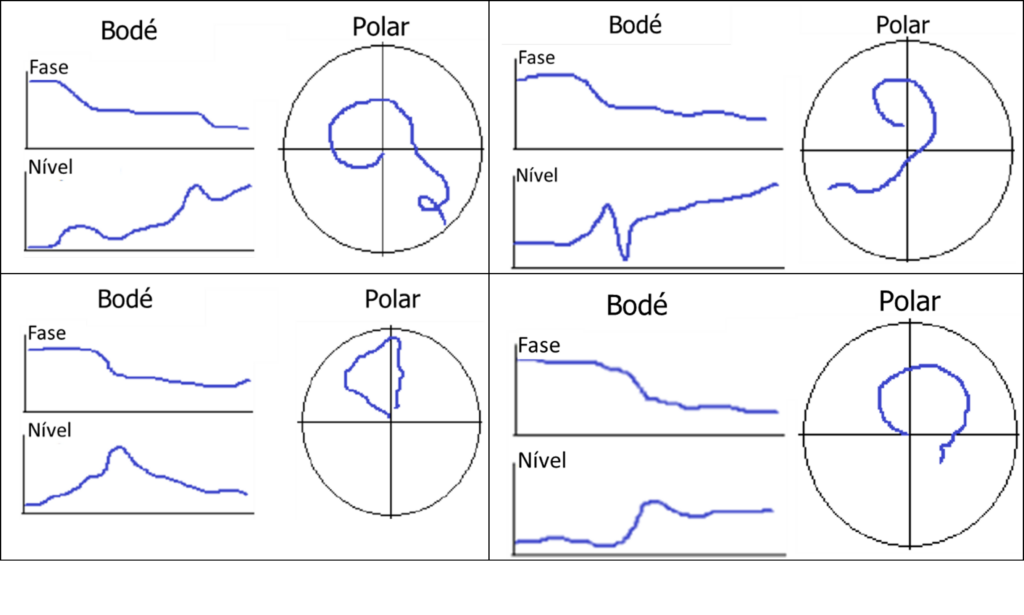
Amplitude reductions due to the change of position of the axis of rotation
Sometimes, a brief decrease in amplitude is also observed before or after the critical velocity peak. This drop corresponds to a brief moment of self-balancing of the rotor in the transition between rotation axes.. If it's before the critic, indicates that the resonant response is dominant, and if seen after the critic, indicates that the rigid mode driven by eccentricity and centrifugal force is dominant as seen in the graphs below.
Turbomachinery and Polar diagram - Figure 12
Rotation axis position change
When a straight line is visible on a Polar chart, over a range of phase angles, this indicates that the overall alignment of the axis of inertia is changing, Driven by inertia axis self-alignment tendency, after a critical speed. That is, the shaft is changing from rotation around the geometric axis to rotation around the axis of inertia.
Turbomachinery and Polar diagram - Figure 13
This is often seen with a simultaneous change in shaft centerline position in one or more bearings.. Additionally, num set of multi-rotors, a rotor with a greater mass (often the generator, or an LP turbine) will pull the lightest rotors (usually in an outer bearing, often an HP turbine or an exciter) for your own alignment line “natural” based on eccentricity or heavy rotor bearing alignment. This will be visible as a straight line on a polar plot in combination with a change in the position of the shaft centerline..