Vibration Monitoring and Edge Compunting
This article deals with vibration monitoring and Edge Computing.
Vibration Monitoring and Edge Compunting – What is it
In the context of a vibration sensor used in predictive maintenance, mounted on a machine, a Edge Computing is the architecture where data processing and analysis occurs directly on the sensor or on a device very close to it, as a gateway. This eliminates the need to send all raw data to the cloud for analysis, making the process faster and more efficient.
- How does the vibration sensor work??
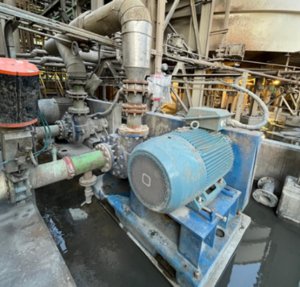
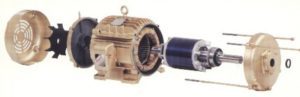
- Data collection at the source: The vibration sensor, installed directly on the asset (ex: motor, compressor, bomb), collects real-time, high-frequency vibration data.
- Local Processing: Instead of transmitting large volumes of data to the cloud, the sensor itself (if it is a sensor “intelligent”) or a small computing device at the edge (O “Edge”) runs AI and machine learning algorithms to analyze data locally.
- Smart Filtering and Sending: The edge device processes the data and sends only critical information to the cloud, as failure alerts, diagnostic summaries or data considered anomalous.
Vibration Monitoring and Edge Compunting – Main Advantages
The application of Edge Computing to machine-mounted vibration sensors brings crucial benefits:
- Latency Reduction: Analysis and decision-making occur in milliseconds, allowing alerts to be triggered in real time. This is essential to avoid unplanned downtime and catastrophic failures..
- Network Efficiency: The volume of data sent to the cloud is drastically reduced, minimizing bandwidth costs and network congestion.
- Data Security: The raw data, that may be sensitive, do not need to leave the industrial environment to be processed.
- Operating in Challenging Environments: The analysis system can work even in remote locations or with intermittent connectivity, since it does not depend on a constant connection to the cloud.
- Cost Reduction: Lower volume of data transmitted and greater agility in fault detection result in lower operational and maintenance costs.
In short, Edge Computing transforms the vibration sensor from a simple “data collector” for one “real-time analyst”, enabling more agile predictive maintenance, economical and safe.
Vibration Monitoring and Edge Computing What parameters are used
These parameters provide an overview of vibration energy and intensity over time. They are often used for trend monitoring and early anomaly detection.
Time Domain Parameters
These parameters provide an overview of vibration energy and intensity over time. They are often used for trend monitoring and early anomaly detection.
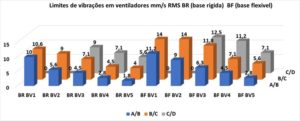
- Valor RMS (Root Mean Square): It is the most common value for evaluating the overall energy level of vibration. RMS is an excellent indicator for the overall condition of the machine. An increase in the RMS value may indicate problems such as misalignment, unbalance or mechanical play.
- Peak Value (Peak Value): Represents the maximum amplitude of the vibration signal. High peaks may indicate point impact forces, such as those caused by failures in bearings or gears.
- Kurtosis: It is a statistical metric that measures the “pico” of a signal. An increase in kurtosis indicates that the signal is becoming more “pointed”, which is a strong indication of incipient failures (initials) bearing. It is one of the first metrics to signal the beginning of a problem.
- Crest Factor (Crest Factor): It is the relationship between the peak value and the RMS value. An increase in this factor suggests the presence of shock impulses in the signal, which are characteristic of bearing damage.
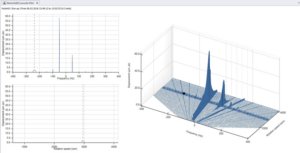
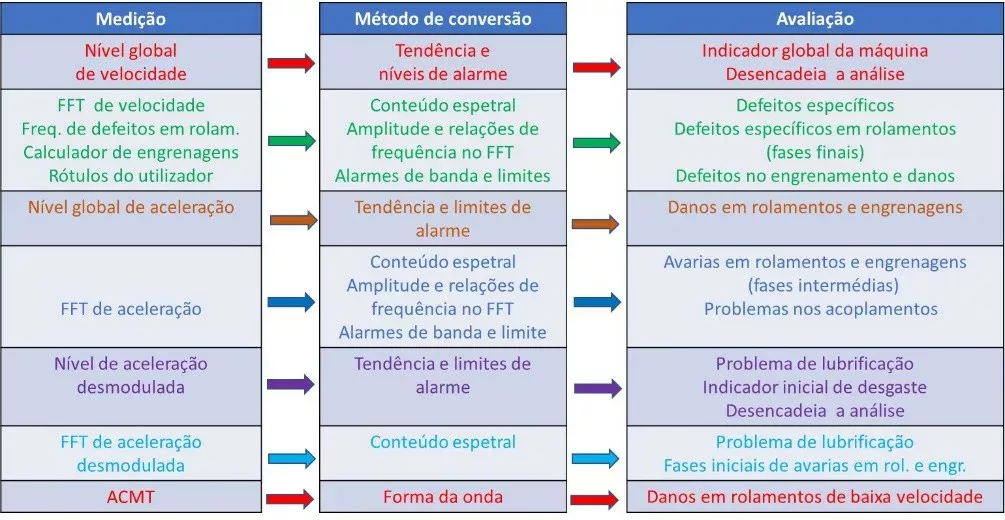
Frequency Domain Parameters
These parameters are essential for accurate diagnosis, as they allow you to identify the exact origin of the vibration. The edge device can perform a Fast Fourier Transform (FFT) to convert the signal from time domain to frequency domain.
- Rotation Frequency (1x RPM, 2x RPM, etc.): Analysis of multiple frequency peaks of machine rotational speed (RPM) may indicate problems such as misalignment and unbalance.
- Bearing Failure Frequencies: Each component of a bearing (outer track, inner track, spheres, cage) has a specific failure frequency. The algorithm at the edge is trained to look for spikes at these signature frequencies, diagnosing the problem before it becomes serious.
- Acceleration Envelope: It is a technique used to “filter” the vibration signal to enhance high-frequency vibrations, which are generated by bearing and gear failures. Envelope analysis is crucial for early fault detection.
Other Complementary Parameters
Beyond the vibration, the sensors “smart” and Edge Computing systems can integrate other data for a more complete analysis.
- Temperature: A sudden or gradual increase in equipment temperature can correlate with an increase in vibration, indicating overheating due to faults.
- Rotation Speed (RPM): Essential for frequency domain analysis, because failure frequencies are directly proportional to rotation speed.
When processing these parameters locally, Edge Computing allows the system to make quick decisions (how to trigger an alarm) and send only valuable information to the cloud, reducing latency, data traffic and operational costs.
Vibration Monitoring and Edge Computing How it is implemented in FASIT and ADASH
The implementation of Edge Computing in ADASH's FASIT system can be understood through its workflow and product architecture.
The basis of the implementation is the division of data processing between the field device (the vibration analyzer, like the VA3 or VA5Pro) and core software (o DDS).
a) Data Collection and Analysis at the Edge (Edge)
The core of Edge Computing in FASIT resides in the vibration analyzer. Instead of simply collecting and storing the raw vibration data, the device processes them in real time, at the place where the measurement is taken.
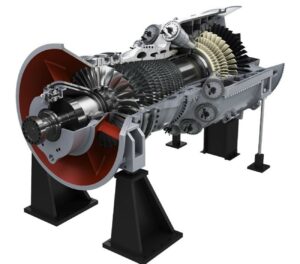
- Sensors: The analyzer uses accelerometers to capture machine vibration. The vibration signal is a complex, high-frequency wave, that if transmitted in full, would generate a very large volume of data.
- Local Processing (O “Edge”): HE IS FACULTY, which is an artificial intelligence algorithm embedded in the analyzer hardware, receive this signal. It performs Edge Computing processing, performing the following local analyzes:
- Calculation of Time and Frequency Parameters: FASIT automatically calculates parameters such as RMS value, or peak, kurtosis and Fourier transform (FFT) to generate the frequency spectrum.
- Automatic Diagnosis (Embedded AI): Based on these parameters, FASIT compares vibration signatures to a vast database of fault knowledge. It automatically identifies common machine defects, What:
- Imbalance
- Misalignment
- Mechanical clearance
- Defects in bearings and gears
- Assessment and Summary Generation: The result of this processing at the edge is an instant assessment, displayed directly on the analyzer screen with a traffic light system (verde, yellow, red) and indication of which fault was detected.
b) Data Transmission to the Cloud/Central Software (o DDS)
After local analysis, only crucial information is sent to the DDS software (Diagnostic and Data System), which acts as the component of “cloud” or system central storage.
- Transmitted Data: Instead of the full vibration wave, what is transmitted to the DDS are the results of the diagnosis:
- The severity of the failure (for example, “imbalance” with an alert level “yellow”).
- The main vibration parameters (as the general RMS value).
- DDS features: The central DDS software stores and manages this summary data, allowing the user:
- Monitor Trends: Create long-term trend charts for failure severity.
- In-depth analysis: Allow a human vibration analyst to examine the frequency spectrum and complete waveform (if it has been saved) for a more detailed analysis.
- History and Asset Management: Create a complete health history of plant assets for more effective predictive maintenance planning.