Turbomachinery and Shade Center Line
An important measurement made with the Vibration analyzers is the one of turbomachinery starts and stops and Line of the Center of Veio (Shaft Center Line- SCL). The latter is carried out based on the capacity of the proximitors measure the distance (DC) between its top and the shaft.
This article belongs to a series, which constitutes the support material for the course on vibration analysis in turbomachinery. Links to the other articles can be found on here.
The importance of Vein Center Line
Orbit and time base present dynamic data (that change quickly) from the position of the shaft, but do not show changes in the mean position of the shaft, which is also an important feature of the system response. These changes are caused by changes in static radial load or by changes in the stiffness characteristics of the rotor system.. They routinely occur during starts or stops and during steady-state operation of the rotor system., over relatively short or long periods. When a rotor system with fluid film bearings changes speed, there are changes in bearing stiffness characteristics, that cause a change in the mean position of the shaft. Like this, changes in shaft position can provide very important diagnostic information.
The mid-vein centerline plot provides this information.. This graph is designed to show changes in mean shaft position; like this, the graph is effectively low-pass filtered and does not display rapidly changing data (dynamic). However, when information from the shaft centerline graph is combined with other information, like known clearances, dynamic orbit behavior and centerline graphics of other bearings, we can get a more detailed picture of the movement of the shaft, its relation to available clearances and static radial loads acting on the machine.
The average shaft centerline plot is often used to display changes in shaft position versus velocity., but it is also used to display changes in shaft position versus time, so that changes can be correlated with changing operating conditions. Once some malfunctions (misalignment, friction and fluid-induced instability, to name a few) can produce visible changes in centerline behavior, the shaft centerline plot is a very important tool for correlating with other plots when performing diagnostics.
Information contained in the Vein Center Line graph
The average shaft centerline graph can be used to infer a lot about the state of a machine condition.:
- Can be used to measure shaft position angle and estimate shaft attitude angle and load direction;
- Can be used to monitor bearing wear, electrostatic erosion and thermal effects;
- The starting and stopping behavior of a shaft in a fluid film bearing can be compared with the theoretical and historical behavior;
- The change in shaft position relative to the clearance circle is normally used to deduce whether the change in shaft position is appropriate for the expected operating condition and bearing geometry.;
- Shaft position Shaft position can be compared between bearings, couplings and sensing machines to detect potential misalignment or coupling problems;
- Finally, changes in load or operating conditions often result in changes in shaft position; these can be examined for signs of abnormal behavior.
Characteristic curve of a proximitor
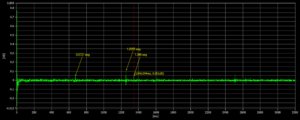
The following figure shows a typical calibration chart for a given material and transducer. The object distance in proportion to the transducer tip is given by the abscissa (x axis) and the output voltage of the conditioner is given by the ordinate (eixo and).
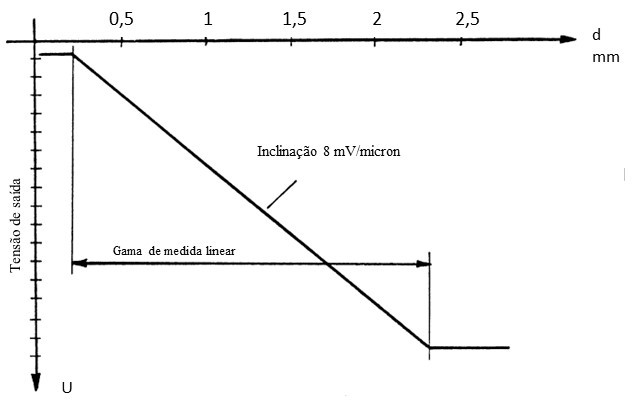
Turbomachinery and Shade Center Line – Figure 1- Typical calibration graph – as distance increases voltage becomes less and less
during installation, the transducer is located at an optimal distance from the target, that is, in the middle of the linear measuring range. This is called the starting distance. (GAP adjustment). When the machine is stopped and only a DC component.
If the target moves, leading to variations in the distance separating it from the transducer tip, the output signal of the conditioner is not constant, but varies in direct proportion to the target's peak-to-peak movement (AC+DC).
Alternating voltage component indicates target vibration on either side of starting distance, as shown in the following figure. Representa, therefore, the dynamic movement of the target.
The peak-to-peak amplitude represents the total vibration distance of a shaft, that is, from the shortest distance to the longest distance from the transducer. This dynamic signal can be employed for measurement or monitoring purposes..
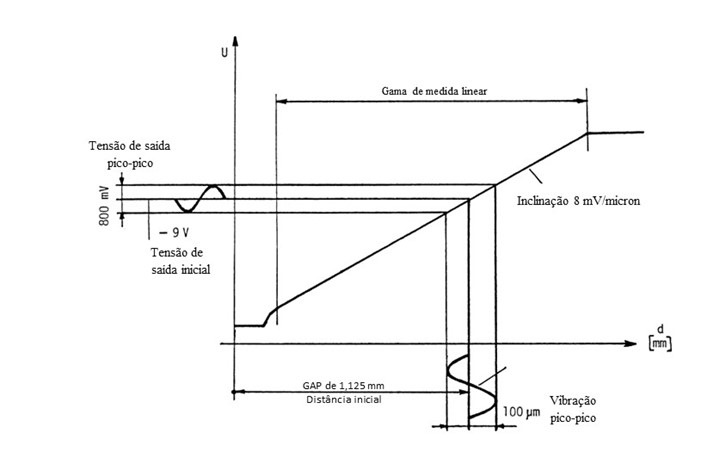
Turbomachinery and Shade Center Line – Figure 2 – Measuring the relative movement between the sensor and the shaft
The DC component serves to measure the distance from the probe to the target..
Or pair of proximitors
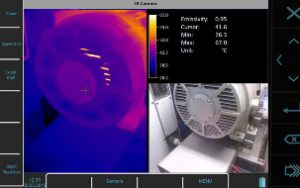
The time signal provides important and useful information, how they are carried out, this information is limited. In this type of movement, on anti-friction metal bearings, where the oil film dampens vibrations in the bearing housing, the signal in time, supplied by an accelerometer, it is not the most suitable.
To monitor this movement, displacement sensors that measure the relative vibration between the shaft and the housing, are more suitable, especially when installed in pairs.
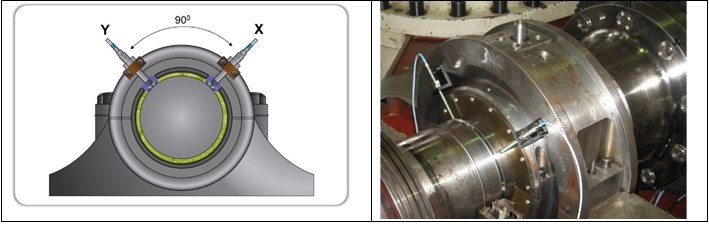
Turbomachinery and Shade Center Line – Figure 3 -Vibration monitoring with proximitors on machines with oil film bearings
With two relative vibration displacement sensors (proximitors) there are conditions to know the movement of the center of the shaft in this plane.
This information can be viewed in two different ways.:
- Average position of the center of the shaft in its clearance in the bearing
- Movement of the center of the shaft – Orbit
The average position of the center of the shaft in its play in the bearing (Shaft Centrer Line – SCL)
Shaft Center Line graph displays average shaft position due to changes in static radial load or rotor stiffness characteristics.
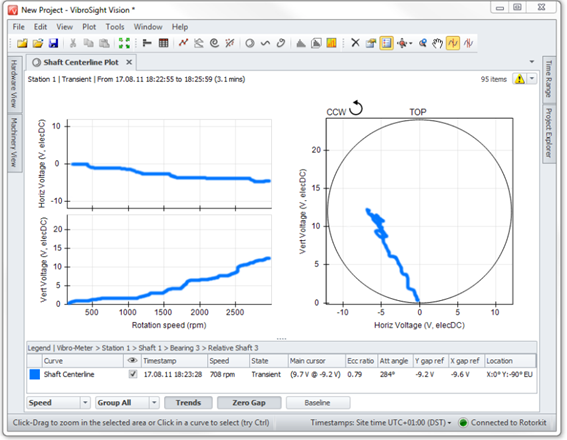
Figure 4 – The Vein Center Line plot displays the average position of the vein
Below you can see a video on this topic..
The interpretation of the presentation of pAverage position of the center of the shaft in its play in the bearing
In the following figure, you can see the meaning of the information presented in the SCL graph.
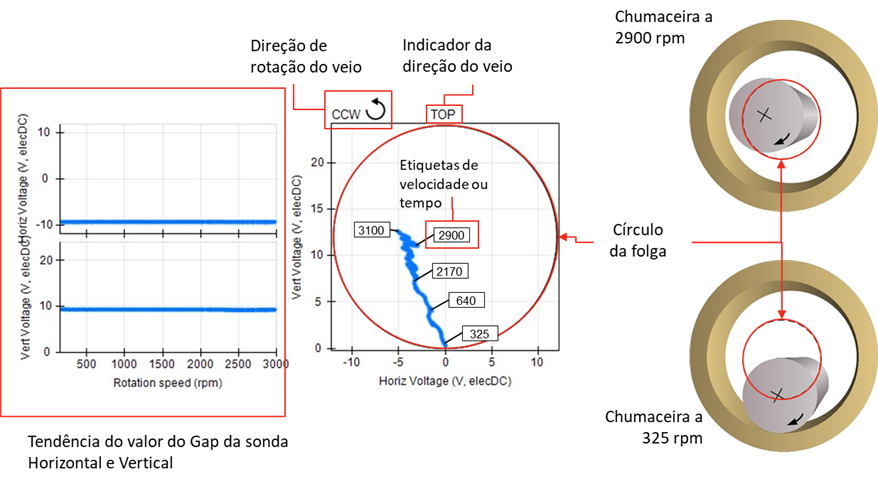
Turbomachinery and Shaft Center Line - Figure 5 – Meaning of the information presented in the SCL graph
The center position came when the machine is stopped
When viewing shaft centerline graphs, it is necessary to locate the starting position of the shaft in the gap, to get a graph that corresponds to the movement of the shaft, with respect to the clearance circle.
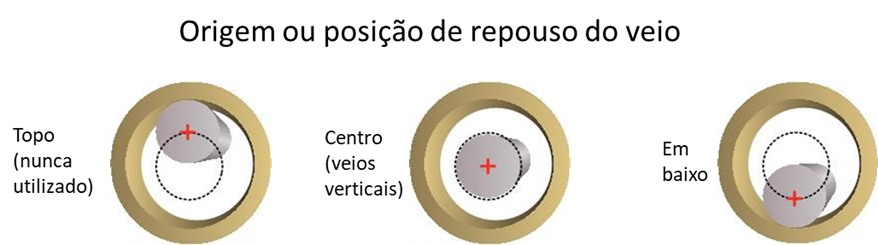
Turbomachinery and Shaft Center Line - Figure 6 – Locating the shaft home position in the clearance on a horizontal shaft
eccentricity ratio
Any force that places a lateral preload (radial) on the rotor can result in a change in the position of the shaft centerline.
- Preloads can result from:
- Misalignment Thermal growth
- box deflection
- tube deformation
- rotor scrubbing
- pumping
- Gravity
- Misalignment due to thermal growth/deflection is the main cause of excessive lateral preload in steam turbines..
- The eccentricity ratio is used as a measure of the shaft response to lateral preloads.
The eccentricity is the ratio of the distance from the center of the shaft to the center of the bearing, divided by the radial clearance of the bearing
Usually abbreviated as e or IS.
Example 1:
Given: 0,381 mm radial bearing clearance
The shaft centerline data shows that the shaft operates at 0,076 mm from center of bearing
IS = 0,076 / 0,38 = 0,2 high position on bearing
Example 2:
The axis operates a 0,229 mm from center of bearing
IS = 0,229/ 0,381 = 0,6 typical
If the shaft is centered in the bearing, what it is e ?
IS = 0 / 0,381 = 0
If it is against the bearing wall?
IS = 0,381 / 0,381 = 1
Turbomachinery and Shade Center Line – Starting a machine
The combined DC measurements, since the stop, in spinner and speed changes, should be reviewed on a shaft centerline plot. With the machine stopped, it can be assumed that all rotor journals rest on the bottom center of their bearings, on a horizontal shaft machine.
When the rotor assembly is lifted with oil, any misalignment present has the immediate effect of changing the position of the shaft centers in the bearings, because of its rigidity trying to “straighten”.
Note that this misalignment can result from misaligned positions of bearings supporting a set of rotors. “naturally straight”, or an angularly misaligned set of rotors placed with the correct alignment in the bearings (such as when off-center couplings are pulled and screwed), or both.
Then, when turner torque is applied, the inertia of the mass of the rotors will tend to further straighten the rotor assembly, revealing any horizontal misalignment of the bearings as a lateral displacement on the shaft centerline as seen in the following figure.
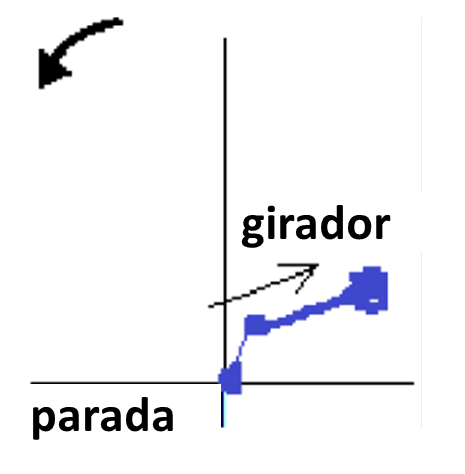
Turbomachinery and Shaft Center Line - Figure 7
Since large rotors are generally flexible, even after observing a self-righting change when entering slow rotation, if misalignment of bearings is large enough, residual static camber often remains in the rotor train.
This provides a source of eccentricity., whose effects can be seen in all other data graphs at higher speeds.
If an individual rotor is too curved and stiff enough, the path of the journal can trace a circle or a flat ellipse on the axis centerline, even at slow rotation speed as can be seen in the following figure.
Turbomachinery and Shade Center Line – Figure 8
For this reason (among others), it is strongly recommended not to use runout subtraction when performing vibration data analysis. The runout vector subtraction was intended to “to clean” the dynamic signs of irregularities on the surface of the bearing, but if the runout vector is an indication of eccentricity, serves to remove the best indication of mass eccentricity, which is often the root cause of a vibration problem.
Turbomachinery and Shade Center Line – “Normal” behavior
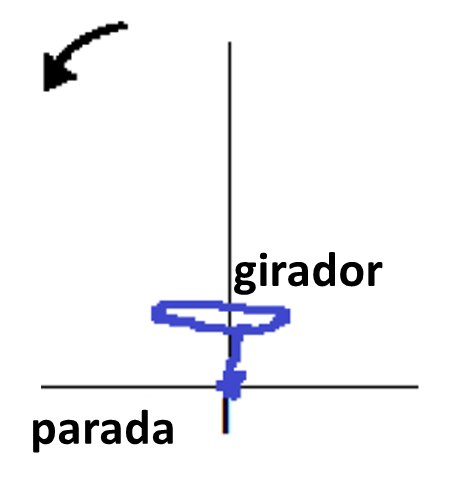
The two trajectories in the figure represent the behavior “ideal” for tilting and elliptical cushion bearings, respectively, as can be seen in the figure below.
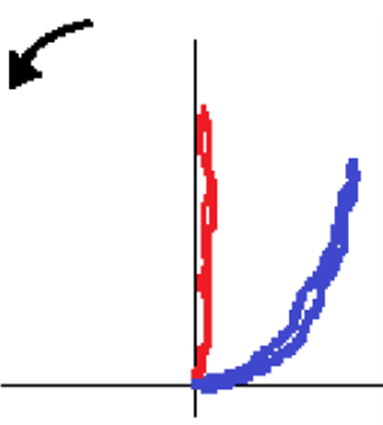
Turbomachinery and Shaft Center Line - Figure 9
| Standard hydrodynamic bearings (previous graphic, azul). | Swing cushion bearings (previous graphic, red) |
| For a given direction of shaft rotation, the shaft centerline path must move in the same direction as the rotation, as the journal moves in the oil film up the bearing side until it reaches an equilibrium elevation angle “pseudo-static” | To the, the trajectory must be entirely vertical |
Shaft center line graphs over the entire speed range provide the best indication of rotor train misalignment relative to the static alignment of the bearing centers.
Turbomachinery and Shade Center Line – the misalignment
If unexpected horizontal movement is observed, this suggests that the bearings are out of position horizontally as can be seen in the figure below.
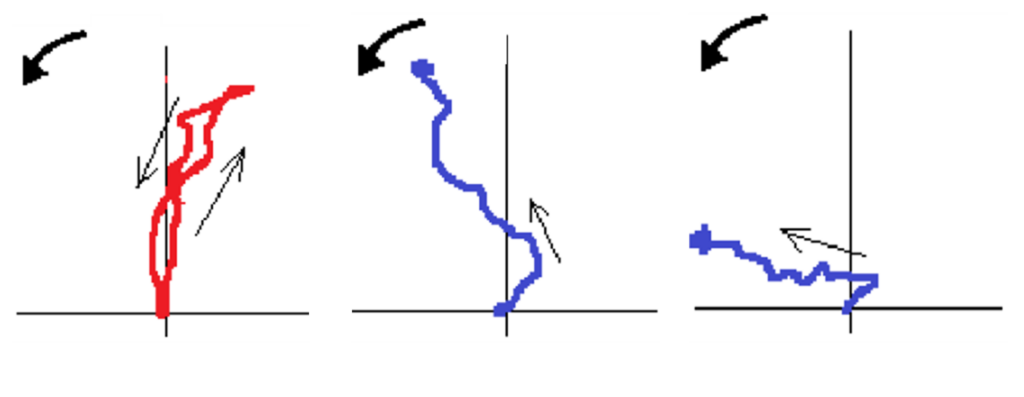
Turbomachinery and Shaft Center Line - Figure 10
This horizontal movement may also indicate that misalignment is the cause of friction or, in severe cases, due to worn bearings (left side chart).
Turbomachinery and Shade Center Line – The causes of hysteresis
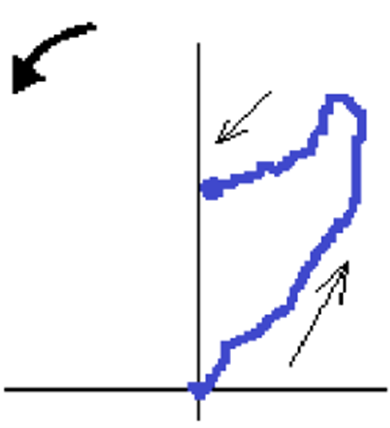
The shaft centerline trajectories also indicate the presence of mass eccentricity when hysteresis is present., with the magnitude of the hysteresis often corresponding to the magnitude of the eccentricity. When an eccentric rotor is accelerated with torque, tends to self-align with its mass axis only after passing the first critical velocity. The overall rotor assembly also tends to straighten proportionally to the applied torque., including up to maximum unit load of MW under maximum torque. If there is an initial misalignment, there may be noticeable additional movement of the shaft centerline at constant speed throughout the load range, as the mass axis of the rotor assembly continues to self-align and straighten with increasing torque and inertia as shown in the following figure.

Turbomachinery and Shaft Center Line - Figure 11
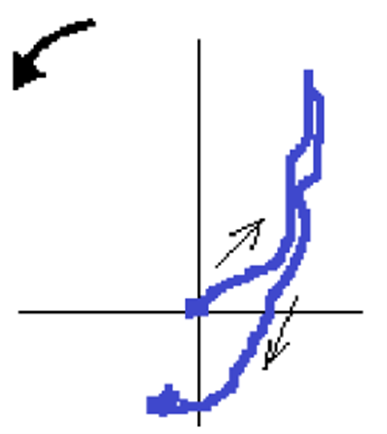
When the torque is subsequently released, and particularly when the rotor descends at speed without torque, tends to maintain the self-aligning orientation it achieved while being torqued, and will often maintain this orientation until it passes below the first critical velocity.. This creates a visible loop in the shaft centerline path. (previous figure).
on some occasions, the position of the vertical axis centerline may be noticeably different for equivalent speed during start and stop. This can be caused by relative thermal expansion between the sensor mounting location and the rotor shaft., or by excessive thermal expansion of the pedestal that lifts a single bearing (such as a steam leak during operation).
When the rotor appears to remain elevated after a stop, there are likely thermal causes creating case distortion or pedestal overgrowth, as can be seen in the figure below.
Turbomachinery and Shaft Center Line - Figure 12
This can cause changes in running alignment and could point to a source of observed friction.. When the rotor appears to fall vertically, even below its cold start position, this is usually due to a relative displacement of the sensors being lifted upwards with the housing or bearing housing (or any component on which they are mounted) due to thermal expansion, as can be seen in the figure below.
Turbomachinery and Shaft Center Line - Figure 13
If the individual shaft centerline paths look typical, but there is a very noticeable vertical discrepancy in the trajectory of the shaft center line, between neighboring bearings, this could indicate a vertical misalignment of the bearing and an incorrect axis of the rotor train. Vertical misalignment can be checked through a combination of reviewing bearing metal temperatures (hot for a high and overloaded bearing, and lowers to an unloaded bearing) and the shapes of the orbit (too flat or compressed if overloaded, or very round if it is without load).
Turbomachinery and Shade Center Line – misalignment checks
If bearing misalignment is indicated, the question that arises is whether the rotor couplings are within tolerances and whether the rotor train itself is straight, with only the bearings misaligned, or if couplings are bent or misaligned, creating an angularly misaligned rotor train within correctly aligned bearings (or, sometimes, both problems are present).
A check of(s) source(s) of misalignment can be done with a proper evaluation of the coupling.
Usually, an angularly misaligned rotor train with poor couplings will create a signature that will often have a high location, although the shaft shows hysteresis.
In the case of a purely misaligned bearing position, Bode and Polar plots can look “correct”, but there will be excessive horizontal displacement or “incorrect” from the center line of the shaft. In both cases, it is very difficult to solve this question conclusively with dynamic data alone.
Besides that, fully evaluated runout data is also very important to include in such an analysis, especially the measurements of all coupling faces with couplings in poor condition will create an eccentricity rotary motion signature, and will often show high amplitudes on a Bode plot at lower speeds at the responsible coupling site, although the vein centerline paths may appear “correct”, although with hysteresis present.
Turbomachinery and Shaft Center Line - Figure 14 – Alignment check equipment