Analysis feed stream
1 Supply Current Analysis – Introduction
This article describes the analysis of the supply current of AC induction motors with the ADASH VA5Pro vibration analyzer
Analysis of the supply current of AC induction motors, It is one of the techniques used for the diagnosis of abnormalities, associated with:
- Broken or cracked bars or high strength points on the rotor,
- The rotor evaluation is carried out from the values in the pole passing sidebands around the grid frequency..
- Shorted turns in stator windings
- The evaluation of the stator is carried out from the difference in 3 current values.
- air gap eccentricity
- The eccentricity evaluation is carried out from values in the characteristic eccentricity frequencies.
- power quality
- The power quality assessment is performed from the total harmonic distortion of the current signal.
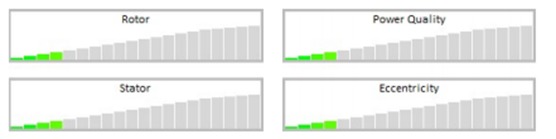
Figure 1 – Conclusions of the supply chain analysis, displayed on the VA5Pro screen
2 electric motors and its importance
The drive machinery and mechanical equipment for electric motors is a matter of extraordinary economic importance. In the field of industrial drives, It is assessed that 70 a 80% of consumed electricity, the set of all industries is transformed into mechanical energy by electric motors.
The three-phase induction electric motor is the most common triggering and an unexpected malfunction this type of machine can have very serious economic consequences. This means that nowadays, is frequent preventive maintenance using the time-based approach to the maintenance of these machines. As the MTBF of this type of machine eight years (for a working 8760 hours / per year), it is common to use very-intervals shorter. However, also they are already common facilities where preventive maintenance is only performed based on knowledge of the machine's working condition. This latter approach, due to economic and inserted also needs in modern maintenance philosophies, It is because of the maintenance management of facilities, where this approach is practiced, feel comfortable with the most common condition monitoring techniques.
Most electric motors used in industry are squirrel cage induction motors.
3 Failures in electric motors
There are numerous studies on the statistical distribution of anomalies in electric induction motors.
Below are the results of a study carried out by ABB.
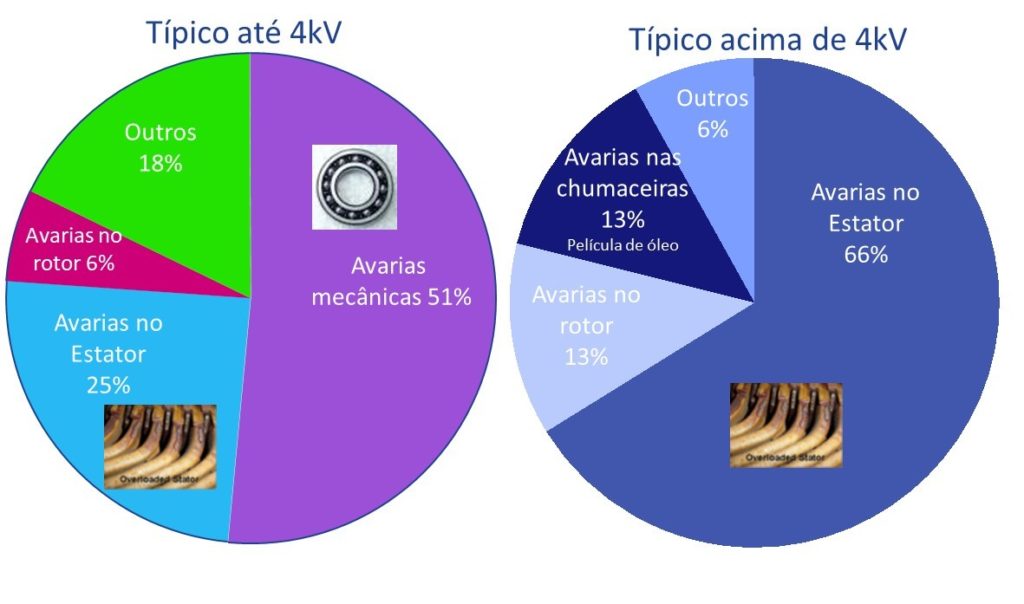
Figure 2 – Statistical distribution of failures in electric motors
Here one sees the importance of identifying damage to the rotor of the electric motors to the analysis of power supply
4 Frequencies produced by electric motors
Frequency | Designation | Expression |
Network frequency | Fr | 50 Hz |
Number of Poles | P | |
Pass Frequency Bars | Fb | Number of rotor bars rpm X / 60 |
Slip frequency | Fd | |
Pass frequency of Poles | Fp | Fd X P |
Some of these frequencies arise in Supply Current Analysis.
5 Factors that generate damage to the rotor
- direct starts, cause high amplitude currents in the rotor (some 10 times larger than the full load) that will cause great mechanical stress, vibrations, a significant increase in temperature causing thermal gradients in the bars;
- The work overload, large fluctuations caused by load or consecutive starts, can have the same effect;
- A round bar generates heat, due to increased resistance, and thermal expansion;
- The adjacent bars support additional current;
- These voltages, especially when compounded by frequent starts, can cause breakage of adjacent bars, warping thermal origin or loosening of the starting bar;
- If the bar is released starting, may cause a catastrophic failure;
- A starter bar does not conduct current;
- When passing a high magnetic flux zone, the forces are unbalanced;
- symptoms, therefore, Similar to the rotor eccentricity;
- The local heating due to poor contact causes warping in the rotor;
- As the engine warms, manifests an imbalance;
- Vibrations may arise at a frequency of rotor bars pass (FPBR).
Other anomalies in the rotor to cause the same symptoms:
- Cracks in bars.
- Poor contact between the bar and lock ring.
- Loose rotor bars in.
- Cracks in the locking ring.
- High-strength joints in wound rotors.
- Porosities casting in molten aluminum rotors.
- ….point of any high resistance.

Figure 3 – Damaged electric motor rotor
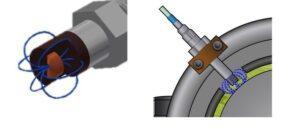
6 Analysis of the supply current of an electric motor in one phase
A supply current analysis uses the analysis of the frequency spectrum of the supply current, taken through the installation of a current transformer (clamp) one phase of the motor supply circuit.
Because of vibrométricas amplitudes may be low, when in the presence of these anomalies, the characteristic of the frequency spectrum of the vibrations may not significantly show the anomaly present. De facto, often, the indicators of the presence of an abnormality in the rotor of an AC motor, They can appear "masked" in the frequency spectrum of vibrations, due to the presence of other possible anomalies.
The analysis of the feed stream Spectrum, the frequencies of interest for the diagnosis of faults in the rotor of an AC motor are designated sidebands to "frequency passage of the poles (FPP)”, present at the mains frequency (50Hz).
FPP = Slip x Motor No Motor Poles
An indicator widely used to assess the severity of the anomalies associated with the rotor bars is the amplitude difference (Kids dB) between sideband FPP left the network frequency and the amplitude of the natural frequency of the network (50Hz).
As a rule, if the amplitude difference between the frequency of the network and the left sideband of FPP exceeds 55 dB, then the motor rotor condition is considered good. The smaller the difference in amplitudes, the higher the estimate bars matches.
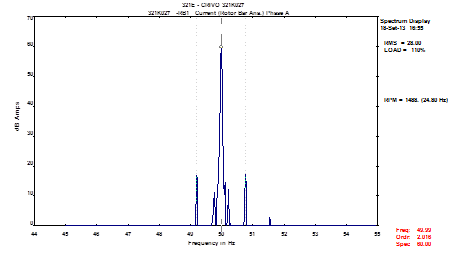
Figure 4 – The supply current analysis – the supply current spectrum
In the example shown in Figure 4, the amplitude difference between the frequency of the network and the left sideband of the FPP is about 46 dB. In this case, there is an indication of the presence of high rotor resistance at points.
The latest equipment, as the ADASH Va5Pro vibration analyzer, have the ability to automatically perform this analysis. The result can be seen on the screen below., by parser (rotor, power quality, stator, eccentricity).
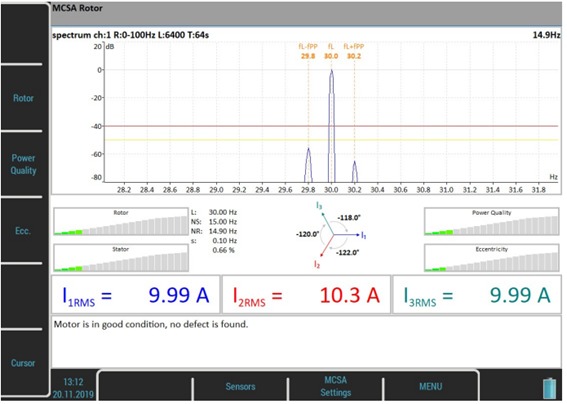
Figure 5 – Conclusions of the supply chain analysis, displayed on the VA5Pro screen
Why this happens
In simple terms, the current flowing in the stator coils depends not only on the power source and the impedance of the stator coils, includes but also the induced current in the stator coils by the magnetic field of the rotor. That is, The stator coils are a probe or “transducer” Non rotor problems. The key issue is to separate the currents flowing through the stator for driving the rotor of the currents that the rotor induces in the stator back if a problem exists. This separation is accomplished by measuring the current components to other frequencies in addition to the network frequency, using a high-resolution frequency spectrum analyzer.
Because the resulting stator current of the high resistance point is modulated on the rotor to twice the slip frequency, a St.1 it is often approximately 1 Hz. This creates a sound “rum” this low frequency that is easily recognized by experienced technicians.
Additional frequency components, due to defects rotor, They are seen as side bands around the frequency component of the network frequencies given by the formula:
f =(1±2ks) f1
at where
s is the slip per unit rotor;
f1 is the supply frequency;
k is 1, 2, 3, etc.
The currents in the rotor cage windings produce AC magnetic field, which has the same number of poles as the stator field, but the wheel slip frequency relative to mechanical rotator. If there is an asymmetry in the rotor current, This results in a backward rotating field (this is slower), the frequency of the slip relative to the stator magnetic rotor rotating forward. The asymmetry arises if one or more of rotor bars are broken / split or break there are a short circuit ring that prevents current from flowing through them. It can be shown that this rotating field back, is rotating in fact forward (1 − 2s) times the frequency of the network, respect to the stator. This induces currents in the stator coils at a frequency f1(1 − 2s), which is referred to as the lower side band at twice the slip frequency the broken bars / split in the rotor. This current causes a cyclical variation of the current that causes a fluctuation in torque at twice the slip frequency and the speed of oscillation that is a function of the inertia of the motor. This rotor speed oscillation creates an upper sideband at a frequency f1(1 + 2s). Broken bars and split ( General points and high strength) do rotor, consequently, result of induced current components in the stator coils at the frequencies given by the formula (2):
FSB = f1 (1±2s)
7 Analysis feed stream – What is air gap eccentricity?
The existence of asymmetry in the squirrel cage causes a non-uniform distribution of magnetic flux in the air gap, causing an imbalance of radial forces, being the most critical time the boot time.
The eccentricity, corresponding to a significant problem in induction motors, caused by a non-uniform air gap.
- Static eccentricity
- Dynamic eccentricity
Possible causes may be due to:
- unsuitable tolerances of the components,
- rotor incorrect positioning relative to the stator,
- Deformations of the shaft,
- Malfunctions related to bearings, desalinhamentos, rotor imbalances, resonances…
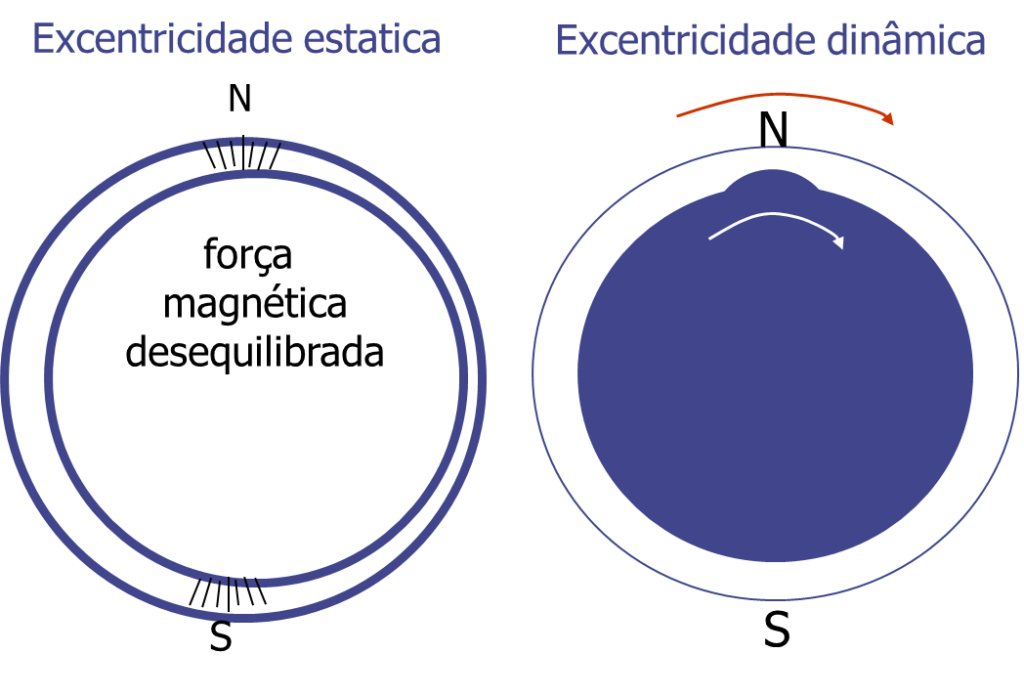
Figure 6 – types of eccentricity
Rotor to stator contact
The process that causes the rotor to contact the stator as a result of eccentricity begins with a decrease in the air gap on one side and an increase on the opposite side.. In an alternating magnetic field, the result of the decrease in the air gap is a greater force of attraction through the smaller space. the reluctance, which is the opposition to the passage of the flux in the path of the magnetic flux, is reduced due to the smaller air gap. The magnetizing current can generate more flux through the smaller air gap, leading to greater attraction and, at the same time, the air gap is increasing in the opposite direction of the machine. Reluctance is greatest in the largest air gap, so the flux and magnetic side pull are reduced. The greater pull on the side of the smaller air gap tends to move the rotor in that direction., making the gap even smaller. This process can continue until the clearance becomes zero and the rotor contacts the stator core.. However, if there is any eccentricity in the air gap, as always happens, why does this contact not occur more often? The answer is that rotor motion is restricted by the mechanical stiffness of the rotor..
Electric signature of eccentricity
As cavas do rotor, due to variations in magnetic reluctance caused by their pit openings, give rise to high-frequency components in the main air-gap flux waveform of a squirrel-cage motor. This phenomenon can induce electromagnetic flux in the stator winding and consequent current components can flow in the stator..
These flux waves rotate with respect to the stationary stator winding and their frequencies are given by the following equation:
frs = f[(R∕p) (1 − s) ± nωs]
Where
- frs = rotor pit pass frequencies in Hz, a series of component frequencies spaced twice the power frequency
- f = power frequency
- R = number of rotor slots
- p = pairs of poles
- s = slip frequency
- nωs = integers for the fundamental time domain mmf (nωs = +1), and its odd harmonics, 3, 5,…
Example of eccentricity effect on vibrations
The following can be seen the effect on the vibrations, of the frequency of passage of pits, to oscillate in amplitude, through the day-night cycles, in an engine with the housing exposed to the sun and, therefore, subject to deformations of thermal origin, with the period of 24 hours.
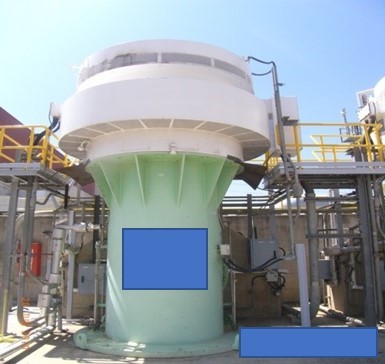
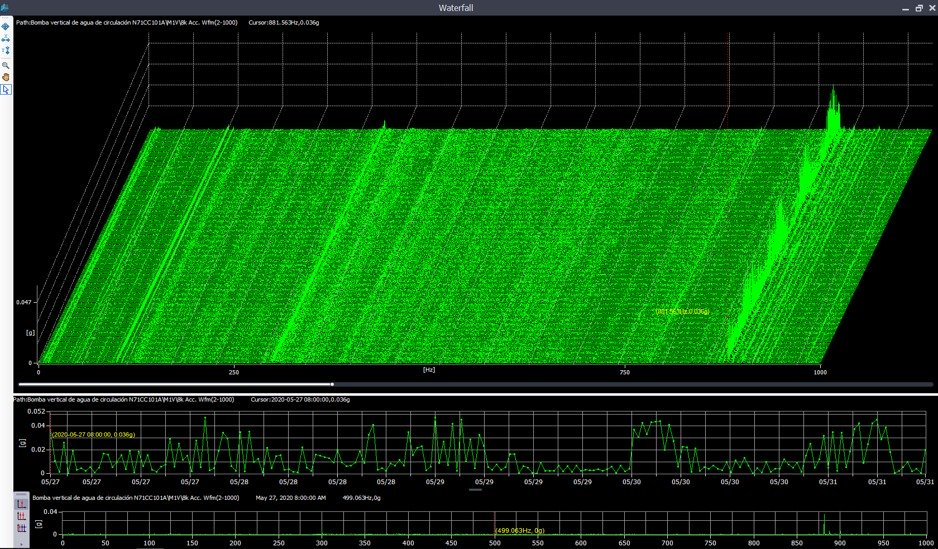
Figure 7 – Effect of eccentricity on vibrations due to asymmetrical heating of a motor housing by exposure to sunlight.
The importance of knowing thenumber of rotor bars
This information must be available for eccentricity to be evaluated..
The latest equipment, how the ADASH Va5Pro vibration analyzer has the ability to automatically perform this analysis. The result can be seen on the screen below..
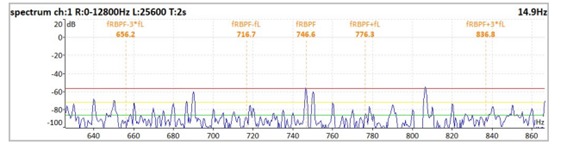
Figure 8 – The evaluation of eccentricity
The characteristic frequencies of eccentricity are marked in the previous spectrum. This means rotor bar pass frequency (fRBPF) and their odd sidebands (fRBPF +/- fL e fRBPF +/- 3fL). Limits for eccentricity identification are also marked.
8 Analysis feed stream – power quality
The power quality assessment is performed from the total harmonic distortion of the current signal.
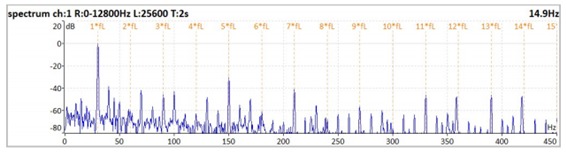
Figure 9 – Measurement of harmonic content in the supply current
Mains frequency harmonics are marked in the spectrum.
The conclusion of the evaluation is given immediately by the analyzer.

Figure 10 – Warning! Chains include harmonics. They are likely caused by power or electromagnetic imbalance in the motor..
9 Analysis feed stream – Short circuit detection in the stator windings
The evaluation of the stator is carried out from the difference in 3 current values.
However, in relation to this type of faults, it should be noted that short circuits in coils in a stator winding, cannot be subject to trend analysis, because either they exist or they don't exist and, if present, will soon become a phase-to-ground fault.
The current values in the three phases are displayed on the analyzer.

Figure 11 – Results of current measurements on three phases simultaneously.
You can also see the phase difference between phases.

Figure 12 – Phase difference between phases
10 Case study analysis of current supply - electric motor of a screen
A rotary screen having an identical configuration to that shown in Figure 13, It is driven by an electric motor with an AC power 250 kW 1488 RPM. This machine is included in a predictive maintenance plan by measuring and Vibration Analysis. Given the criticality of the machine within the production process, a fortnightly inspection period has been defined with a vibration analyzer.
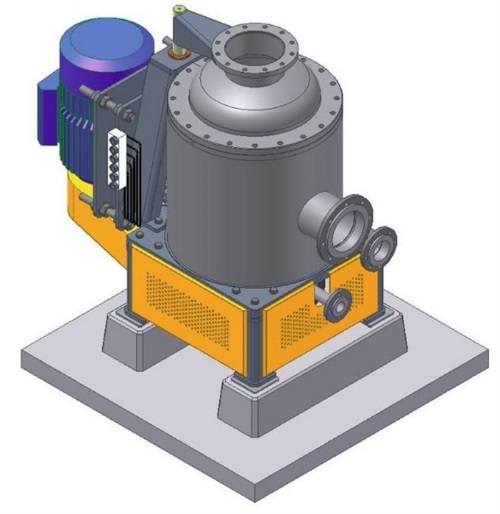
Figure 13 - Analysis of the feed stream – Scheme machine indicating the vibration measurement points
10.1 initial situation
Under the plan inspections defined, the machine was inspected on 11 September and, As can be seen by the trend graph overall level of vibrations (Figure 14), engine condition was considered acceptable and did not show any change considered significant.

Figure 14 - Analysis of the feed stream – the global trend graph vibrations recorded in point 2
10.2 Inspection on 14 of September
no day 14 of September (3 days after the last routine inspection) the technical services of DMC were called overnight for Production, because the operators have identified noise and vibration levels not characteristic of normal operation of the machine. In vibrométrica inspection carried out on 14 of September, was identified an increase in the presence of vibrométricos levels engine, as can be seen at the Global Level Trend graph shown in Figure Vibrations 15.
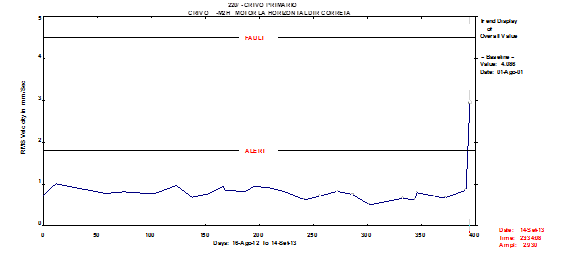
Figure 15 - Analysis of the feed stream – Global Level Trend Graph Vibration recorded at the point 2 no day 14 of September
The analysis of the defined frequency spectra revealed that the increase of severity was vibratory, about everything, influenced by the operating frequency range of the respective harmonics and (Figure 16). In the same analysis, also drew attention the fact that the spectral noise ("Weapon"), in the frequency range between the operating frequency and the first harmonic, meet high. By virtue of such, Frequency spectra were recorded on a high-resolution.
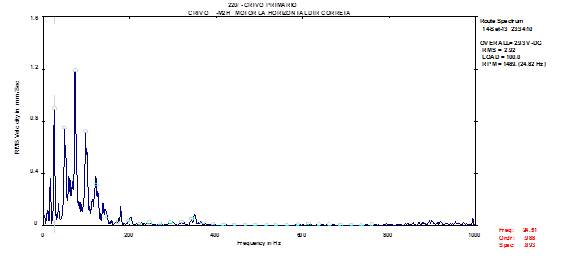
Figure 16 - analysis of the feed stream – frequency spectrum recorded at the point 2 no day 14 of September
The analysis of the frequency spectra of high resolution, revealed that the motor operating frequency and corresponding harmonics, come accompanied by sidebands (Figure 17).
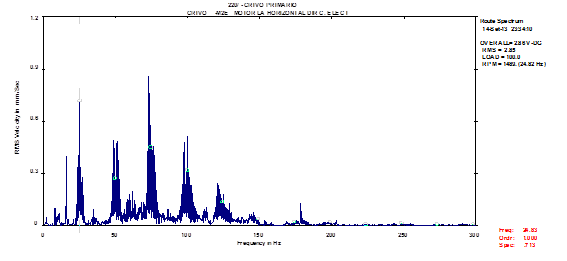
Figure 17 - Analysis of the feed stream – frequency spectrum of high resolution
The same analysis also revealed that the sidebands appear at a frequency of 0,76 Hz (Figure 18), which coincides with the frequency of passage of motor poles. Given the analysis performed, the presence of the respective operating frequency and harmonics, accompanied by sidebands to the frequency of passage of the poles, It is a characteristic condition of developmental abnormalities in the rotor, namely: points of high resistance; bars start / cracked; casting defects in the case of rotors made of aluminum. as a note, It is noted that the rotor bars crossing frequency (38 bars in the engine analysis - 943 Hz), is not present in the frequency spectra recorded (see Figure 4)
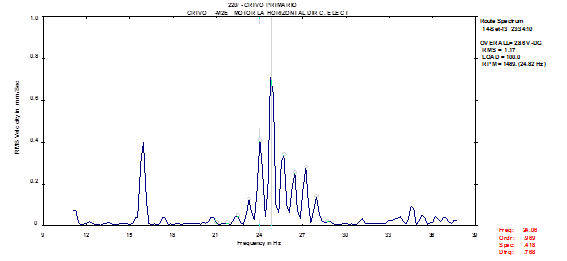
Figure 18 – Analysis of the supply current – Zoom High resolution frequency spectrum revealing the presence of the sidebands 0,76 Hz, around the engine operating frequency
10.3 recommendation made
Because the diagnosis made, was recommended that the customer, as soon as possible, proceed to replacement of the engine. As the situation occurred during the night and weekend, the customer questioned whether the intervention would have to be immediate or it could wait for the start of the week that they might schedule an installation stop. Knowing which are the engine starts (maximum current), the factor that contributes most to accelerate the development of this anomaly, It was communicated to the client that the engine was not subject to many start-ups and were subject to monitoring vibrométrico, It would be expected to intervene if he could perform at the desired height.
10.4 Analysis of the feed stream
As the engine was in surveillance, no day 18 of September, the supply current spectrum measurements were made for, with another inspection technology, also carry out the evaluation of the rotor state. In the figure 19, It shows the spectrum of the feed stream, in which one can observe the presence of the frequency of the grid accompanied by a sideband frequency of passage of the poles. The amplitude difference between said frequencies already indicated the presence of at least one starter bar / fissured.
Figure 19 - Analysis of the feed stream – frequency spectrum of the motor power supply
10.5 Situation after replacement of the engine
The engine was replaced on day 19 September and vibrométrica inspection performed after intervention, It noted a decrease in the severity vibrométrica presence in machine. As can be seen in Figure 20, registered vibrométricos levels fell to values characteristic of the machine in question.
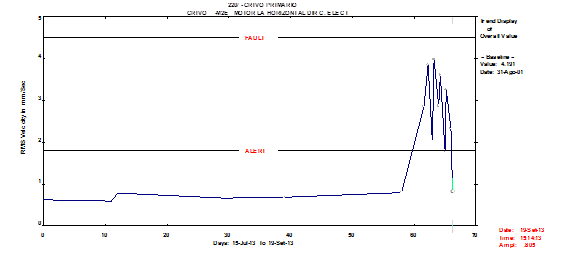
Figure 20 – Supply chain analysis - Global Level Trend Graph Vibration recorded at the point 2 no day 19 of September
The frequency analysis of the recorded spectra showed the disappearance of the sidebands associated with the frequency of passage of motor poles, As can be seen in Figure 21.
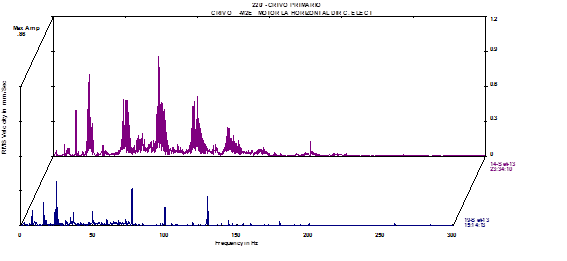
Figure 21 – feed stream analysis - Frequency spectra recorded before and after replacement of the engine
Also the spectrum of the feedstream showed the disappearance of said sideband (Figure 22).
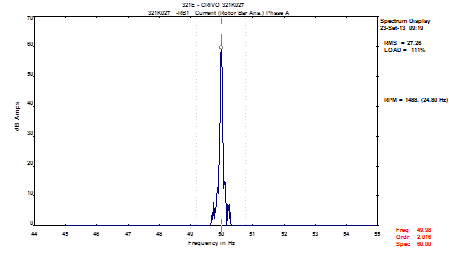
Figure 22 - Analysis of the feed stream – frequency spectrum of the motor supply current recorded after replacing
10.6 Photos of the damaged rotor
In the figure 13, It presents a set of photographs where you can observe the rotor status of the replaced engine.
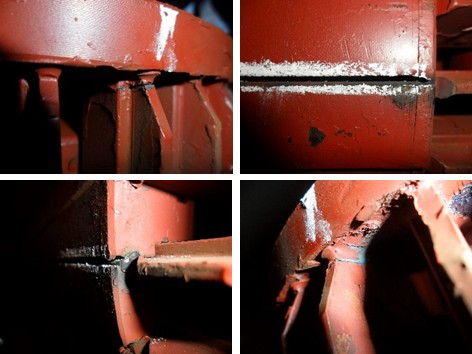
Figure 23 – Analysis of the supply current – Photographs of the motor rotor substituted