Circular Presentation Vibration Analyzer
Circular Presentation Vibration Analyzer
1 Circular Presentation Vibration Analyzer – Introduction
In this article the vibration analyzer the Circular Presentation will review some aspects of this type of presentation.
gears, press rollers and bearings are examples of machine parts where vibrations are associated with shape defects. Even knowing this, most of the time when observing the waveform to confirm any diagnosis, the most used presentation is a function of time.
This presentation being, undoubtedly essential, circular presentation is often a useful and little-known adjunct to vibration analysts.
When it takes placeVibration Analysis in machines, in a vibration analyzer when performingpredictive maintenance, commonvibration analyzer This article presents the vibration limits in rotary-dynamic pumps as defined in the ISO series of standards..
2 Circular Presentation Vibration Analyzer – What does the circular presentation consist of
If a shaft rotates through an angle of 360º why not represent the corresponding vibrations in a circle instead of representing them over time? In this way the defects in shape associated with a given position, they will always appear in the same place making it often easier to identify and making this tool an important diagnostic aid.
Next in Figure 1, you can see the circular presentation of the waveform in acceleration of the vibrations of a roll with defects in profile.
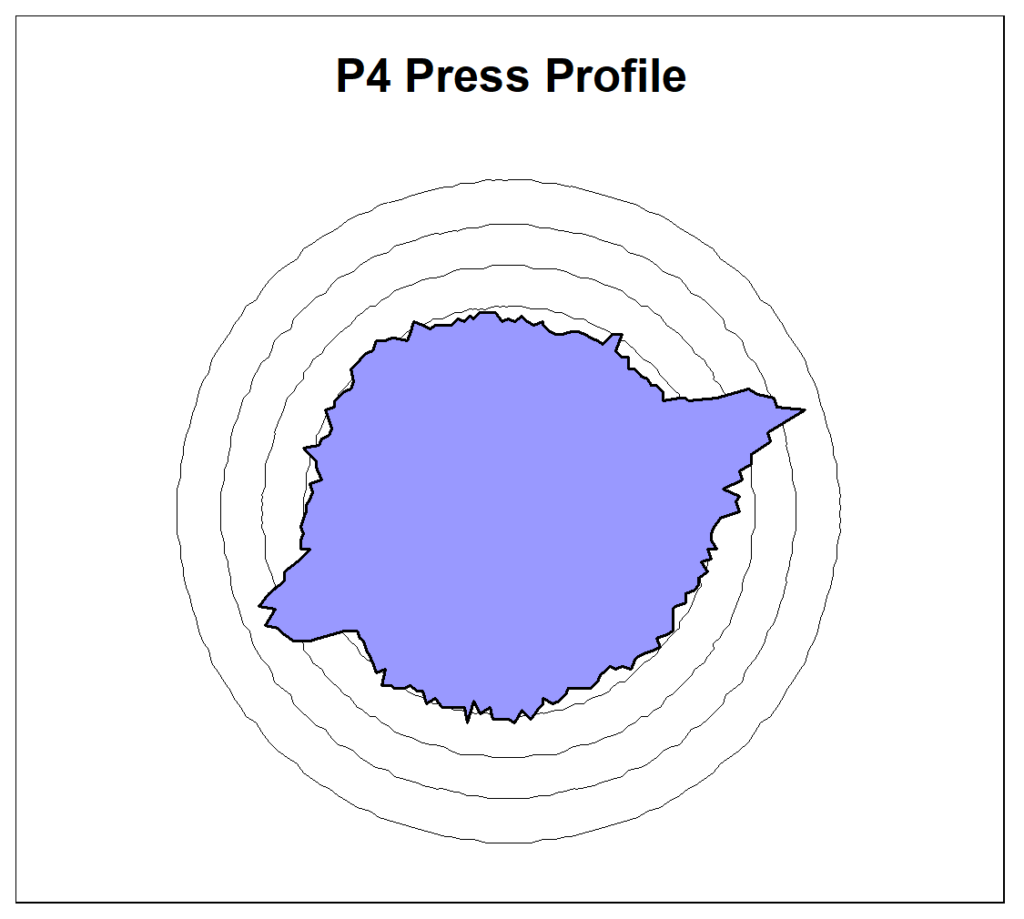
Figure 1 – Circular presentation of the vibrations of a roll with profile defect
3 Circular Presentation Vibration Analyzer – Implementation techniques for circular presentation
There are several possibilities for this approach to the representation of vibrations, namely:
- simple waveform
- With the synchronous mean of the waveform
- With envelope waveform and peak hold ( PeakVue)
3.1 the waveform
This is the simplest form of the circular representation and to carry it out it is enough to have the exact rotational speed of the shaft, what is normally accessible.
By itself, it is often difficult to interpret due to interference from other sources of vibration..
3.2 The Synchronous Average of the Waveform
This technique consists of performing measurements of the waveform, synchronized with the rotation of one of the shafts and the execution of an average of these measures. As a result of this synchronization, asynchronous events with the realization of the average, tend to zero, while synchronous becomes more visible.
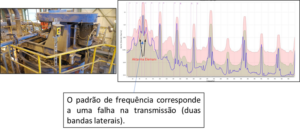
This is achieved, for example, in a gear, from a single vibration sensor, separate the vibratory effects of a pinion from those of a crown, making it possible to obtain two distinct Frequency Spectra. In addition to this, in the Time Signal obtained with the average, clear defects are formed, such as cracks.
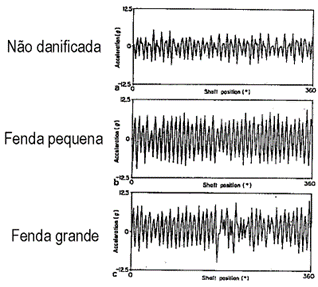
Figure 2 – Detection of cracks in gears using the synchronous mean of the waveform
The implementation of this technique requires the existence of a tachometric sensor that permanently informs the measuring equipment about the rotation speed of the shaft where the vibration measurements are being made..
This technique has traditionally been applied to complex and highly responsible gears such as helicopters for determining tooth defects., and in presses of paper machines or rolling mills to determine the source of vibrations in order to avoid quality problems.
It allows, for example, on two rolls of a press rotating at the same speed, distinguish the vibrations generated by a, from the vibrations generated by another, as illustrated in Figure 3.
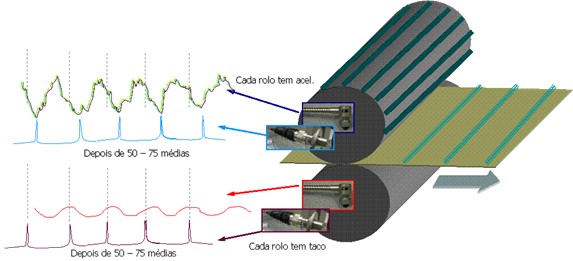
Figure 3 - Implementation of synchronous average in paper machine press rolls
The circular presentation of these vibrations allows you to visualize the profile of each roller, clearly identifying the vibration generator, and causing quality problems on paper.
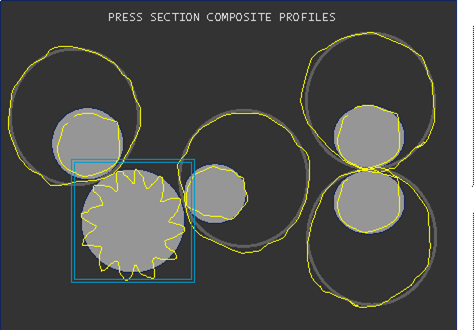
Figure 4 – Circular representation of vibrations in paper machine press rolls
It can be said that the synchronization of measurements works as a filter that allows us to exclusively observe/separate the vibrations of one source from the others..
3.3 Envelope waveform and peak retention (PeakVue)
PeakVue is a variation of envelope analysis that aims to accurately measure shock amplitudes., feature that traditional envelope analysis lacks.
Envelope Analysis can extract periodic impacts like those that occur in a deteriorating bearing, the vibration of a machine. It can do this even when the impacts are of low amplitude and are “submerged” in other machine vibrations. On the envelope spectrum, regular bearing impacts show up as a spike (possibly with some harmonics) bearing frequency corresponding to the location of the fault, that is, outer track, inner track, sphere or cage.
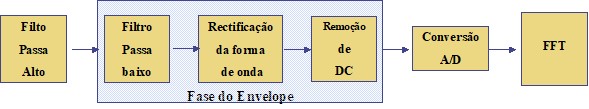
Figure 5 – Block Diagram of the traditional Envelope Analysis implementation
Next you can see an example of application in a bearing in an electric motor. O spectrum Normal , the above, shows defect symptoms in inner race , unclear. The spectrum envelope, below, shows clear symptoms of defects in the inner race.
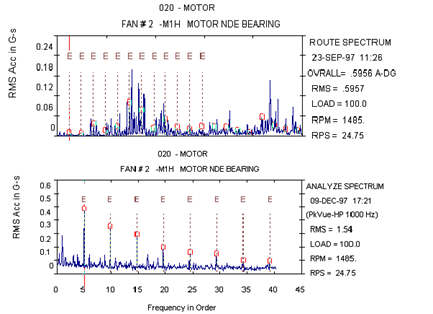
Figure 6 – Spectrum and Envelope Spectrum
In review by PeakVue, after passing through a high pass filter, sampling is carried out at a high frequency (100 KHz), regardless of the maximum spectrum frequency, to ensure that it correctly detects the extent of the impact of peaks. These samples are then used to reconstruct a waveform that will be used to calculate the frequency spectrum.. In this reconstructed waveform, each sample retains the highest value of the sample set from which it originated.2)
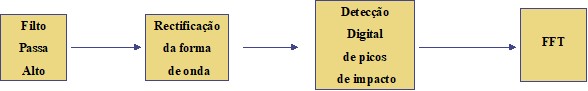
Figure 7 – Block Diagram of the PeakVue implementation
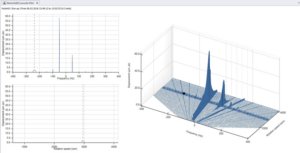
The PeakVue waveform can also be displayed in a circular shape as shown in Figure 8.
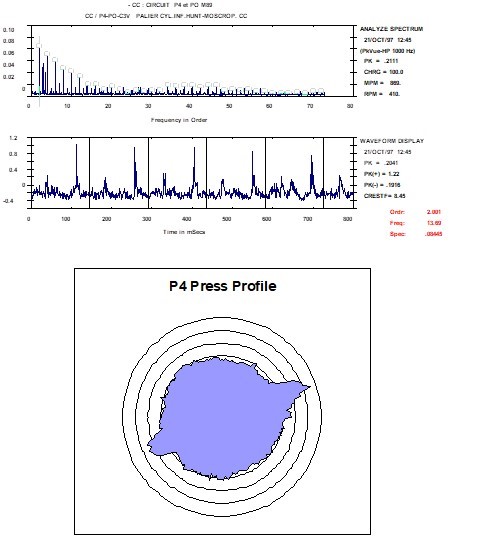
Figure 8 – Spectrum and Waveform of PeakVue and respective circular representation of a roll of a paper machine press with two shape defects on its surface.
The advantage of this technique over synchronous averaging is that it does not require a tachometric sensor.. Effectively as PeakVue is a measurement at high frequencies and these are dissipated in the machine's structure, there is no interference phenomenon between the different measurement points. In other words, the vibrations measured at a point are exclusively those at that point.
4 Circular Presentation Vibration Analyzer – Application examples
Below are some examples of application of the circular representation..
4.1 Press roll form defect
Paper machine press roll with shape defect generated on its surface generating irregularities in the paper.
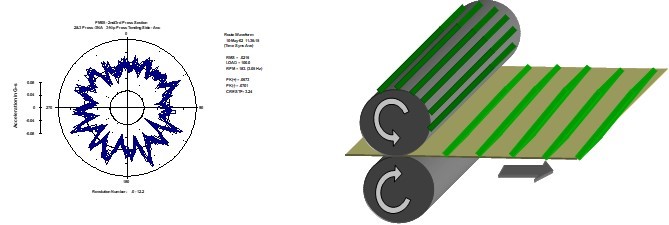
Figure 9 – Circular Representation of Vibrations obtained with Time Synchronous Average of a paper machine press roll with shape defect.
The roll shape defects can be clearly seen..
4.2 Paper machine press - felt defect
Paper machine felt with irregularities on the surface due to damage verified during machine start-up.
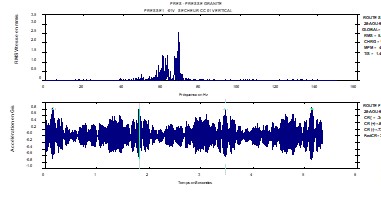
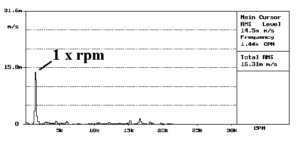
Figure 10 – Spectrum and Waveforms of a faulty paper machine felt. Vibration shows band of energy around the 60 Hz corresponding to a natural frequency of the system
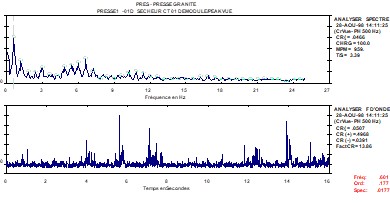
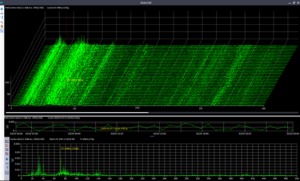
Figure 11 – Spectrum and PeakVue Waveforms of a faulty paper machine felt measured at the same point and simultaneously with those in the Figure 10. PeakVue vibration shows clear frequency components to felt rotational speed (0,6 Hz)
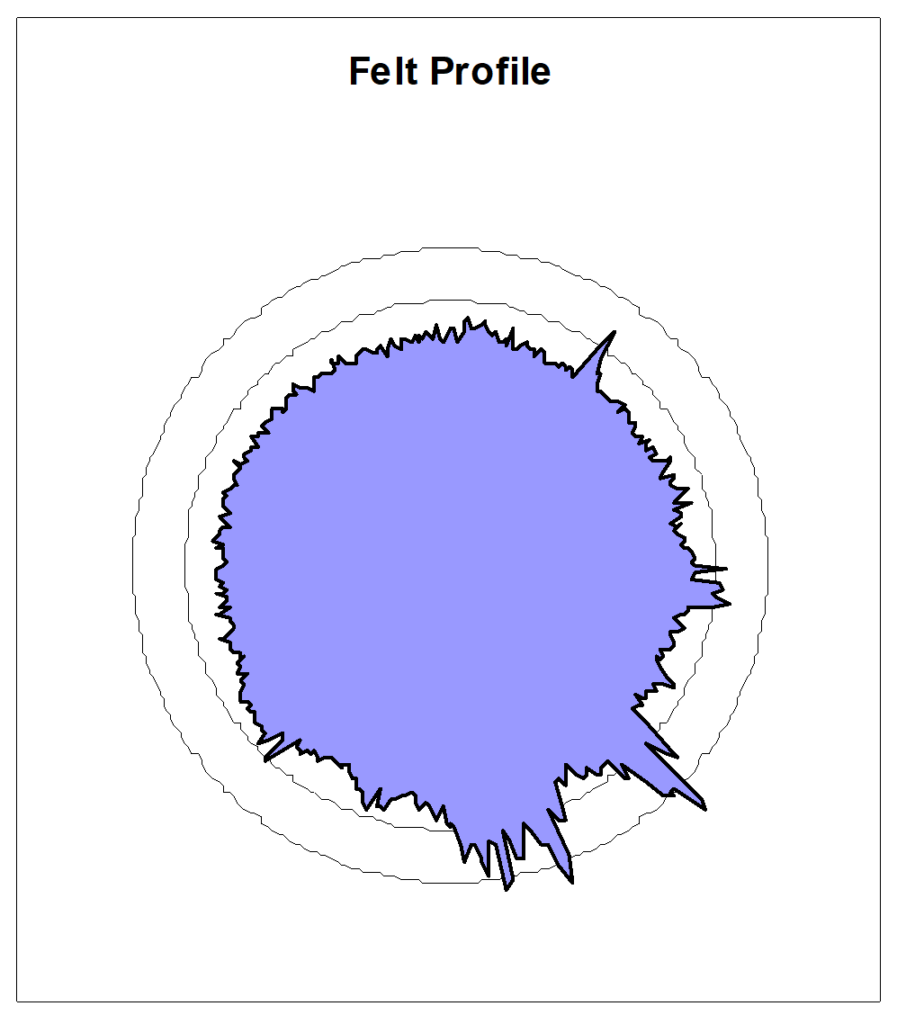
Figure 12 – Circular representation of the PeakVue Waveform of a paper machine felt, with defects, corresponding to the signs that can be seen in the figure. 11.
4.3 Bearing – Distinction between shape defect and lack of lubrication
Figure 13 – Circular representation of the PeakVue Waveform of a bearing with a lubrication problem, showing the irregularity of the impacts
Figure 14 – Circular representation of the PeakVue Waveform of a defective bearing on the outer raceway, showing the regularity of the impacts
Figure 15 – Circular representation of PeakVue Waveform of rolling in good condition
4.4 Gear with stroke every four rotations
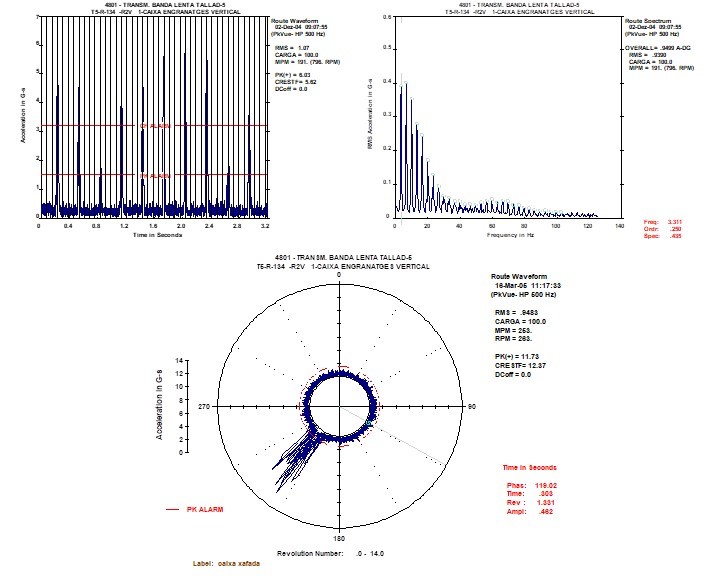
Figure 16 - Wave shape, spectrum and circular presentation of gear with stroke
5 Conclusion
The Circular Representation consists of presenting the waveform of the vibrations as a function of their angular position.
In cases involving the analysis of vibrations generated in form defects, this type of representation can be a useful aid for analysts.