The FFT spectrum in measuring shocks
1 – THE FFT SPECTRUM IN SHOCK MEASUREMENT INTRODUCTION
This article mentions the precautions to be taken during the vibration analysis, This article mentions the precautions to be taken during the vibration analyzer.
This article mentions the precautions to be taken during the predictive maintenance. The most common case is that of bearing damage, but gear failures and clearances are also important..
The characterization of this phenomenon exists a specific approach that is often poorly understood..
effectively, when you want to correctly measure the amplitude of impact peaks, the main parameter to take into account is the sampling frequency of the waveform and not the maximum frequency of the spectrum.
This article will focus on the appropriate approach to the correct characterization of the shock amplitude with an FFT analyzer.
2 – THE FFT SPECTRUM IN SHOCK MEASUREMENT – THE FREQUENCY OF WAVEFORM SAMPLING
In an analyzer the analog signal is sampled in the analog to digital converter and the digital waveform is generated. Then the spectrum is obtained using the Fast Fourier Transform.
a) Waveform sampling
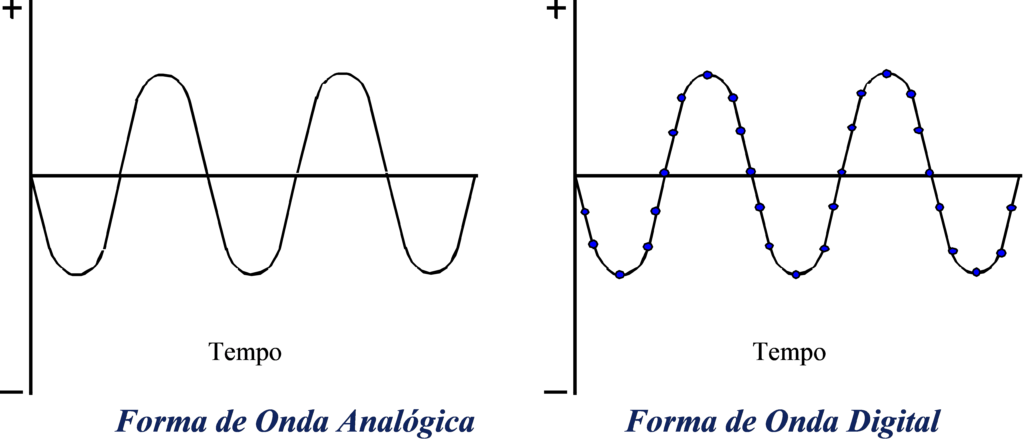
| b) Sampled Signal for a given time interval | c) Corresponding spectrum |
 |  |
The amplitude value of the spectrum line represents, therefore, the sinusoid amplitude and is usually the RMS amplitude. This amplitude is obtained by integrating the time interval corresponding to the waveform in b) which in the case of a sinusoidal vibration gives a good picture of the amplitude of the vibration.
The sampling frequency is defined from the Maximum Frequency of the spectrum multiplied by 2,56 what, it is mathematically known, is the smallest enough to correctly characterize the amplitude of sinusoidal signals.
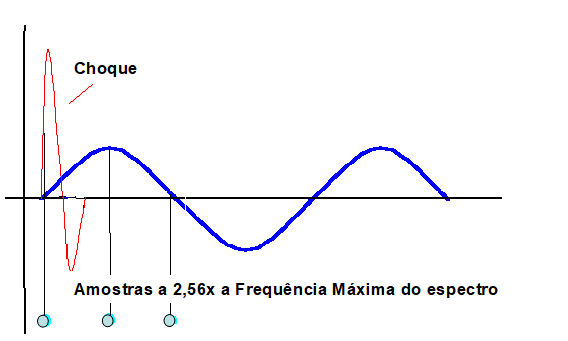
In the case of a shock, the question of sampling is posed differently.
De facto, while sampling at 2.56x the Maximum Frequency of the spectrum is adequate for characterization of a sinusoidal force, it is not for characterization of a shock. For the proper characterization of a shock, a much higher sampling frequency is needed. In this case, the value of the sampling frequency is dictated by the duration of the event to be characterized. As normally a shock is a very short-duration event, the sampling frequency must be very high.
As the sampling frequency is equal to 2,56 times the maximum frequency of the spectrum, this will have to be quite high.
3 – MEASUREMENT OF THE RANGE OF IMPACTS
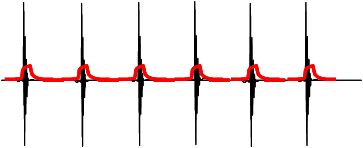
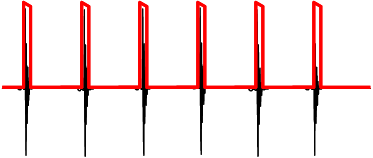
The bearing damage arise in terms of vibrations on how well evident in the waveform shocks.

these impulses, of very short duration, are well detected with a peak detector vibration meter.
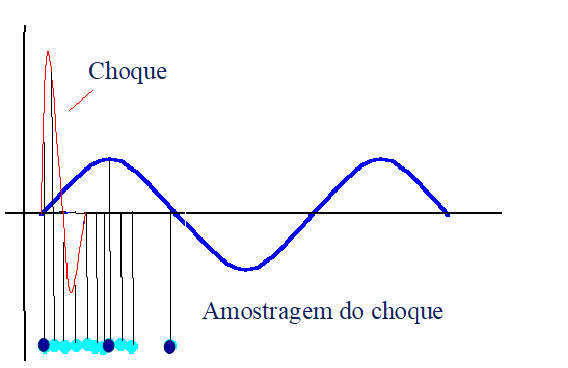
Let's imagine that a bearing to rotate at low speed we want to measure a spectrum up 100 Hz. For this, typically, the analog-digital converter of a spectrum analyzer will get a waveform sampled the 2,56 x 100 Hz = 256 Hz, that is, the waveform will consist of samples obtained from 4 in 4 ms, which is completely insufficient to adequately measure the peak amplitude of the shocks.
To properly characterize a shock that lasts less than a millisecond you have to remove, no minimum, 10 samples per millisecond, for example. have up, therefore, that to properly characterize the amplitude of a pulse lasting one millisecond, a sampling frequency of 10 KHz, which corresponds to a maximum frequency of the spectrum 4 KHz.
If this rule is not followed amplitude which appears on the waveform and the spectrum is not real.
In a bearing with low rotation speed, the fault frequencies are in the order of a few Hz and there is, therefore, to obtain high-resolution spectra, with a high number of lines, such as e.g. 3200.
4 THE FREQUENCY SPECTRUM OF A SHOCK
The representation of a shock in the frequency spectrum is a solid line., as shown in Figure.
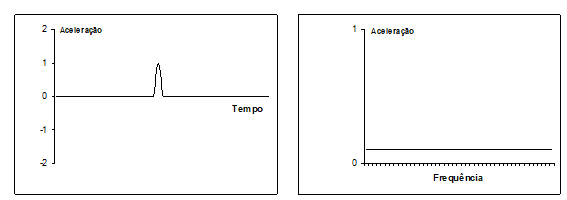
The frequency representation of the shock is usually associated with very low amplitudes and only in extreme cases of terminal phase failure is it usually possible to see. This is due to the fact that other vibrations normally present in a machine have larger amplitudes especially at low frequencies..
Like this, nowadays, to observe shocks, the envelope analysis technique is used, which through the passage of the signal through a high-pass filter, before the analysis, it is much easier to observe the effects of shocks on the waveform and on the spectrum..
5 – A AMPLITUDE DO ENVELOPE
There are those who advise against the use of acceleration envelope for detection of damage in bearings due to the fact that the measured amplitudes are not correct. Others recommend implementing this technique and there are many users, to implement it successfully on a daily basis.
Indeed, the traditional envelope cannot accurately measure the amplitude of events of very short duration.
Commonly used analog filters have a delay in response time which prevents them from taking accurate pulse measurements..
This is why many manufacturers report that the amplitude of the envelope's spectrum components is not exact., and this can only be used for diagnostic purposes.
6 – CORRECT MEASUREMENT OF THE PEAK AMPLITUDE OF THE ENVELOPE WAVEFORM
There are two ways to correctly measure the amplitude of impact peaks:
a) A traditional; use a peak amplitude detector. Peak amplitude measurements of the waveform give correct results but the amplitude of the spectrum components is not..
b) The most recent; first sampling the waveform at a high frequency (for example 100 KHz), regardless of the maximum spectrum frequency, to ensure that properly measure the extent of the impact of peaks. Then these samples are used to reconstruct a waveform that will serve the construction of the frequency spectrum. In this reconstructed waveform, each sample retains the highest value of the sample set from which it originated..
Below follows a block diagram thereby envelope analysis.
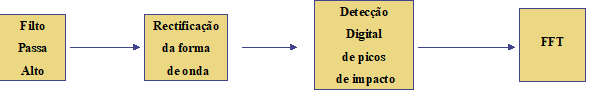
With this approach the amplitude of the peaks in the waveform and the spectrum components is correct..
7 – THE FFT SPECTRUM IN SHOCK MEASUREMENT – CONCLUSION
When you want to correctly measure the amplitude of impact peaks, in waveform and frequency the main parameter to be taken into account is the sampling frequency of the waveform and not the maximum frequency of the spectrum.