Vibration Analysis pumps
The vibration analysis in pumps must be performed periodically
Case 1 – Vibration Analysis pumps – I desaperto
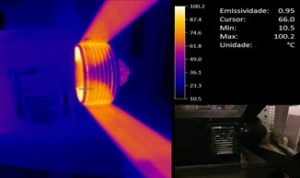
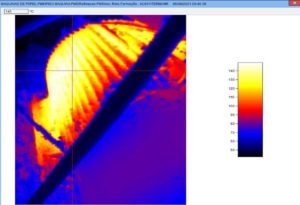
The pump illustrated in Figure 1, It is included in a Predictive Maintenance Program, It is subject to regular inspections vibrométricas, to every six weeks.

Figure 1 – Vibration Analysis in pumps – Pump picture with the identification of measurement points Vibration
During the last routine inspection with a vibration analyzer, We found a significant increase in the presence of vibrométricos levels, particularly, the pump (Figure 2). According to the evaluation criteria adopted, vibrométricos the levels were considered critical in all measuring points defined in the pump.
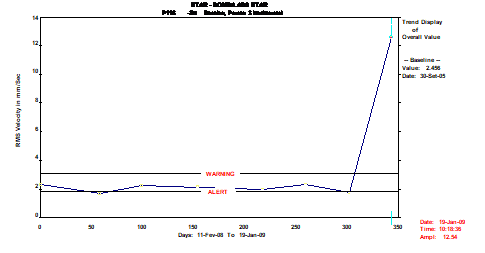
Figure 2 - Vibration Analysis pumps – Evolution of vibrométrico level at the measuring point 3, according to the direction Horizontal
Vibration analysis performed collected the frequency spectra revealed the presence vibrométrica severity in the pump was, about everything, influenced by the operating frequency range (1xRPM) and low-order harmonics, particularly, second harmonic. This feature is illustrated in the frequency spectrum shown in Figure 3.
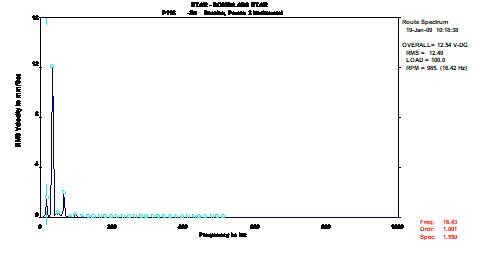
Figure 3 - Vibration Analysis pumps – frequency spectrum recorded at the point 3 according to the direction Horizontal
Following the work procedures defined by DMC, It was performed sensory inspection machine. As a result of this inspection, it was found that the fixing screws between the bracket bearings and the pump body is loosened found (Figure 4).
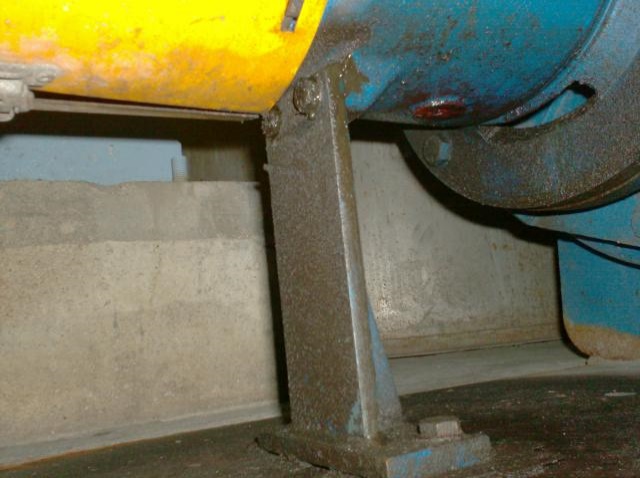
Figure 4 - Vibration Analysis pumps – Photography identifying the screws that were loosened
Given the data collected and the analysis performed was recommended to Customer Technical Services maintenance work for: tightening the fixing screws between the bracket bearings and the pump body and the verification / alignment correction.
Conclusion
In some situations, sensory inspection allows quickly, expeditiously and effectively, identifying the source for the high levels vibrométricos presence in machine. When performed in conjunction with the collection of data vibrométricos, It is a tool that allows, in some situations, minimize the time spent on identifying the causes of the dynamic behavior of machines
Case 2 – Vibration Analysis pumps – Misalignment motor / pump
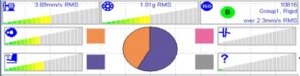
During a routine inspection, They were recorded values at high vibration motor / pump. The frequency spectrum analysis revealed that severity was vibrométrica, about everything, amplitude influenced by the operating frequency of the machine and lower order harmonics (24,57 Hz). This characteristic shown in Figure 5, arises misalignment normally associated with.
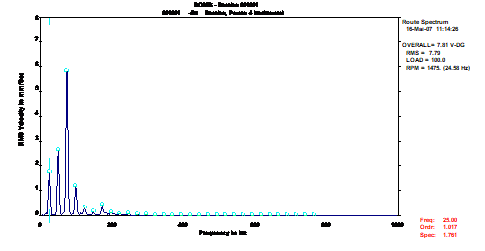
Figure 5 - Vibration Analysis pumps – frequency spectrum collected at the pump, horizontal direction
Since this equipment was booked positional, We were asked to stop the machine and removing the coupling guard union. Careful inspection unearthed a significant misalignment between the motor and the pump (near 0,5 mm).
Technical services have chosen to correct the alignment and make a new measurement of vibrations in order to confirm the diagnosis.
In the second measurement performed, (after the alignment correction) values recorded show a significant improvement in vibration levels (Figure 7).
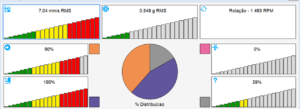
In the figure 6 is the frequency spectrum collected at the pump, group after alignment correction. By simple observation, There has been a significant improvement.
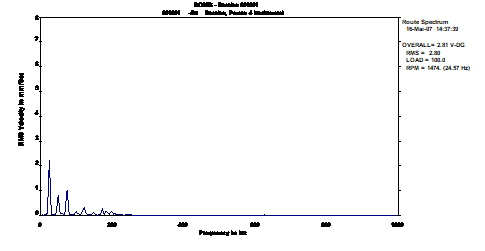
Figure 6 - Vibration Analysis pumps – frequency spectrum collected at the pump, horizontal direction, after the alignment correction
In the figure 7, It shows the trend graph where it is observed the improvement between the two measurements made (before and after intervention).
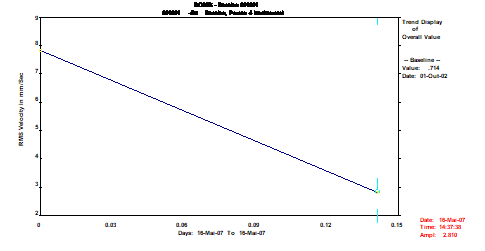
Figure 7 - Vibration Analysis pumps – Graphic trend overall level of vibration values, collected at the pump, horizontal direction
Conclusion
Improving the dynamic condition of the equipment possible to avoid additional spending on coupling components Union (by ex. elastic elements of the union) and maximize the life of rotating components (by ex. rolling etc.).
Case 3 - Vibration Analysis pumps – coupling Degradation
During conducting a vibrométrica inspection, identical to the pump shown in Figure 8, It showed very high levels of vibration (search for 44 mm/s).

Figure 8 – Vibration Analysis pumps – Scheme equipment
The frequency analysis of the collected spectra showed that high vibration levels were recorded, about everything, influenced by the operating frequency range of the motor unit / pump (24,0 Hz) and harmonic (Figure 9). This feature arises normally associated clearances between the mechanical components.
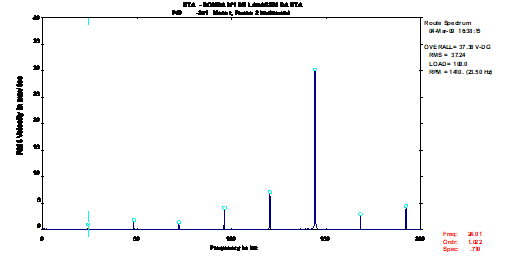
Figure 9 – Vibration Analysis pumps – Spectrum collected at the coupling side of the engine before the intervention
Yet, sensory inspection performed with a strobe lamp, It revealed that the elastic elements of the coupling union were degraded, It is the semi unions to "hit iron with iron". The recommendation for the equipment involved has been to replace the elements of said coupling union.
The next inspection, and after the intervention to replace the elastic elements of the union, a new measurement was made vibrations, by which it was found a significant improvement in dynamic behavior, as can be seen in the frequency spectrum shown in Figure 10.
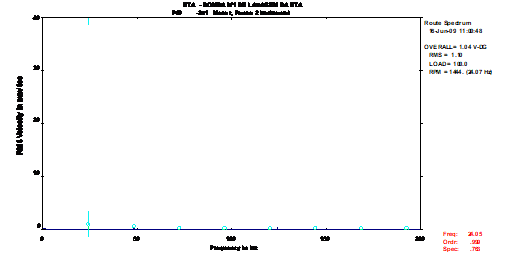
Figure 10 – Vibration Analysis pumps – Spectrum collected at the coupling side of the engine after the intervention
As can be seen in the spectra shown in Figures 9 e 10, There has been a significant change in vibration levels present in the machine.
Figure A 11 summarizes the changes evidenced entres the two measurements made (before and after intervention).
The spectral characteristic shown in Figure 9 It was likely to cause some doubt as, this may also be associated with clearances in the motor bearings. However, with strobe lamp was possible to clearly identify the origin of high levels vibrométricos that the equipment was in submitted.
Like this, we can consider the Strobe lamp an indispensable tool for the condition analysis, it allows, in addition to measuring the speed of rotation of the shafts, the possibility to observe the state of conservation of the elastic elements of the coupling unions, the condition of the transmission belts, as, the ability to view entries, namely, rotating part numbers for any replacement stock., without having to stop the machine.
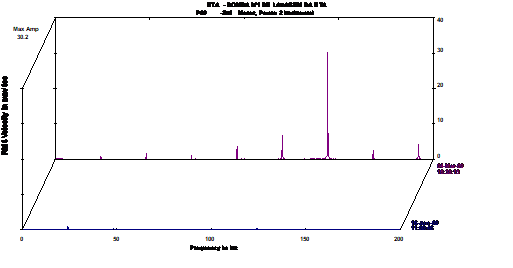
Figure 11 – Vibration Analysis pumps – Spectra collected in the engine. coupling side before and after the intervention
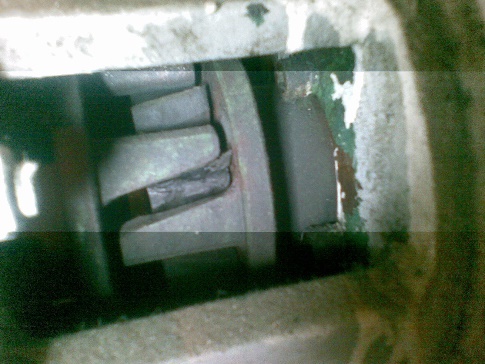
Figure 12 – Vibration Analysis pumps – Example illustrating the use of stroboscopic light for inspection of a coupling union
Case 4 Vibration Analysis pumps – Misalignment in motor pump
The measuring vibrations performed at a pump after the intervention, vibrométricos revealed high levels as can be seen in Table I.
Table I
|
Measuring point |
Vibration level in mm / s RMS |
|
1 Vertical |
4,3 |
|
1 Horizontal |
11,8 |
|
2 Vertical |
3,0 |
|
2 Horizontal |
10,2 |
|
2 Axial |
4,0 |
|
3 Vertical |
3,6 |
|
3 Horizontal |
3,0 |
|
4 Vertical |
2,8 |
|
4 Horizontal |
2,5 |
The main cause of the vibration levels that the equipment was in subject, It was due to misalignment between the motor and the pump, As can be seen in the spectrum shown in Figure 13.
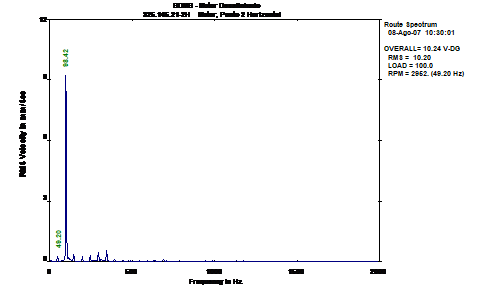
Figure 13 - Vibration Analysis pumps – frequency spectrum collected in the engine, the coupling side
The initial misalignment values were:
|
PLANO |
Misalignment Radial (mm) |
Misalignment Angular (mm) |
|
Vertical |
-0,47 |
0,04 |
|
Horizontal |
0,50 |
0,53 |
|
Tolerance |
0,07 mm |
0,04 mm |
With the realignment of the group was possible to significantly improve the high levels of vibration to which the machine was subjected. In the figure 14 is the frequency spectrum collected in the engine, group after alignment correction.
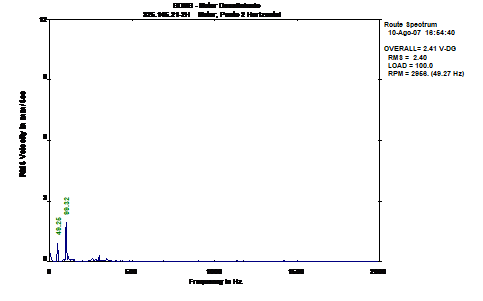
Figure 14 - Vibration Analysis pumps – frequency spectrum collected at the coupling side of the engine, after the alignment correction
The vibrométricos levels recorded after the realignment are shown in Table II.
Table II
|
Measuring point |
Vibration level in mm / s RMS |
|
1 Vertical |
2,4 |
|
1 Horizontal |
1,4 |
|
2 Vertical |
1,8 |
|
2 Horizontal |
2,4 |
|
2 Axial |
2,7 |
|
3 Vertical |
1,9 |
|
3 Horizontal |
2,8 |
|
4 Vertical |
1,8 |
|
4 Horizontal |
2,8 |
From the values shown in Table II it follows that the vibration levels are, currently, considered good / acceptable engine (body which initially registered the highest vibration values)
The residual misalignment values are below those present.
|
PLANO |
Misalignment Radial (mm) |
Misalignment Angular (mm) |
|
Vertical |
0,00 |
– 0,03 |
|
Horizontal |
0,07 |
– 0,04 |
|
Tolerance |
0,07 mm |
0,04 mm |