vibration analysis in electric motors
In this article, an introduction to the analysis of vibrations in electric motors is made. The various sources of electrical and mechanical forces in an electric induction motor are explained.. It is also explained how the engine reacts or transmits this force and how this force can be amplified or minimized..
When a vibration problem occurs, it is important to use a systematic and analytical approach in solving the problem. This includes carrying out the appropriate diagnostic tests.. The process begins by listing all possible causes for the specific identified vibration frequency and any variations under different operating conditions.. Then, the incorrect causes are eliminated one by one until all that remains is the true source of the problem, that can be efficiently disposed of.
The three-phase induction electric motor is the most common drive and an unforeseen breakdown in this type of machine can have very serious economic consequences.. This means that today is often the use of preventive maintenance based on time approach as the maintenance of these machines. As the MTBF of this type of machine eight years in the petrochemical industry ( for a working 8760 hours / per year) it is common to use very-intervals shorter. However, installations where preventive maintenance is only carried out based on knowledge of the operating condition of the machine are also common.. This latter approach, due to economic and inserted also needs in modern maintenance philosophies, also results from the fact that maintenance managers of facilities where this approach is practiced, feel comfortable with the most common condition monitoring techniques.
1. ANALYSIS OF VIBRATION IN ELECTRIC MOTORS – SOURCES OF VIBRATION
There are many electrical and mechanical forces present in induction motors that can cause vibrations.. Besides that, the interaction of these various forces makes it difficult to identify the root cause. In the following sections, the main mechanisms are discussed.
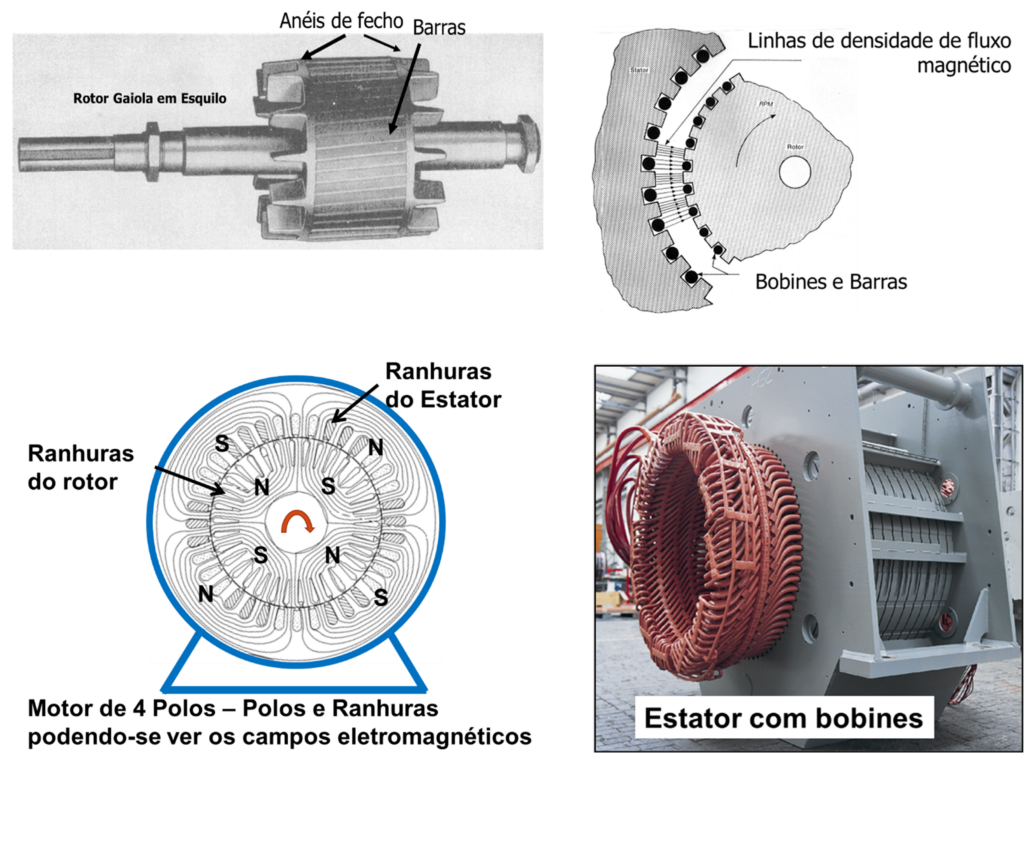
Figure 1 – Stator and Rotor
1.1 Analysis of vibrations in electric motors and vibration at twice the grid frequency (100 Hz)
There are many different forces and interactions resulting from the power source and the interactions between the stator and rotor., as can be seen in Fig.. 1. The power source is a sinusoidal voltage that varies from a positive voltage spike to a negative one on each cycle.. many different problems, electrical or mechanical in nature, can cause vibrations at the same or similar frequencies. It is necessary to look carefully to differentiate the true sources of vibration.
A power supply produces an electromagnetic attractive force between the stator and rotor, which is maximum when the magnetizing current flowing in the stator is maximum, positive or negative, in that instant of time. As a result, there will be two peak forces during each cycle of the voltage or current wave that reduce to zero when the fundamental current and flux wave pass through zero, as shown in fig. 2. This will result in a vibration frequency equal to twice the frequency of the grid frequency..
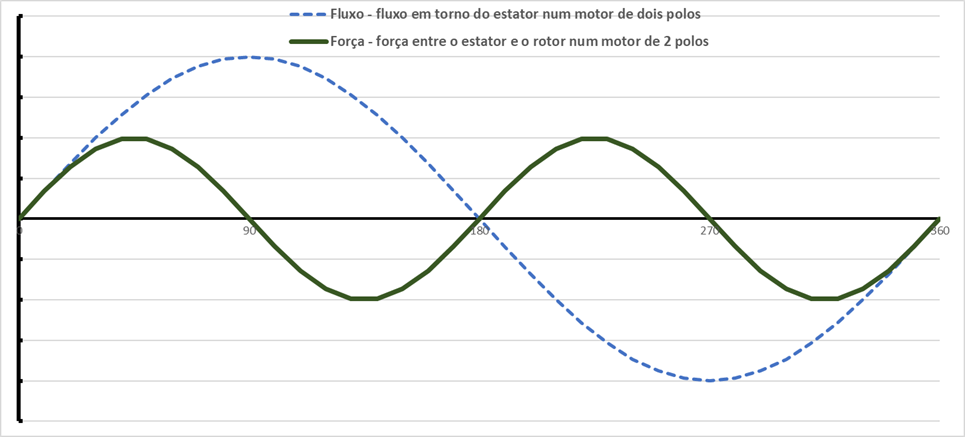
Figure 2. One-period flux wave and magnetic force wave
This specific vibration is extremely sensitive to the flatness of the engine base., the rigidity of the structure and the base and the consistency of the air gap between the stator and the rotor, around the stator. It is also influenced by the eccentricity of the rotor..
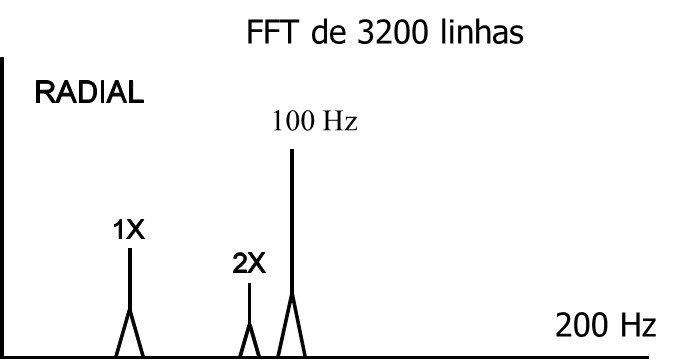
Figure 3 – spectrum scheme with component at 100Hz
1.1.1 vibration analysis in electric motors it's at influence of the load on component a 100 Hz
Some people start from the incorrect premise that the vibration of twice the grid frequency varies with the load.. This misconception comes from the belief that excitation of two-line frequency vibration is due to a magnetic field generated by the current in the stator coil which varies with the load and creates a magnetic force which varies with the square of the current in the stator.. Actually, stator and rotor ampere-turns tend to balance each other out, with the exception of the excitation ampere-turns. To explain this to those unfamiliar with electrical motor theory, the excitation ampere-turns are created by the no-load current of the motor. This establishes the magnetic field in the motor necessary to generate a return electromagnetic field approximately equal to the applied voltage.. As load is applied to the motor, stator and rotor currents increase together and balance each other out, therefore, there are no significant changes in the flow. This means that the basic magnetic forces are independent of the load current and are practically the same at no load or at full load.. Therefore, the principal component of vibration at twice the lattice frequency (100 Hz), which is created by an unbalanced magnetic attraction due to air gap asymmetry, does not change with load.
1.1.2 vibration analysis in electric motors e a mamplitude ripple and slip
in engines of 2 poles, the vibration level of twice the frequency of the lattice will appear to modulate over time due to its close proximity to the vibration of twice the rotation. engine problems, such as friction, loose pieces, a bent shaft or elliptical bearings can cause vibration to 2 times the rotation frequency. Due to its proximity in frequency to the vibration of twice the frequency of the grid, the two levels add up when they are in phase and subtract when they are out of phase and then add up again when they are back in phase. This modulation is repeated at a frequency of 2 times the slip in motors 2 poles. even in empty, double rotation vibration in engines 2 by will vary from 100 Hz due to slip. Since there is some slippage in induction motors, although small in empty, it may take 5 a 15 minutes to slide a rotation.
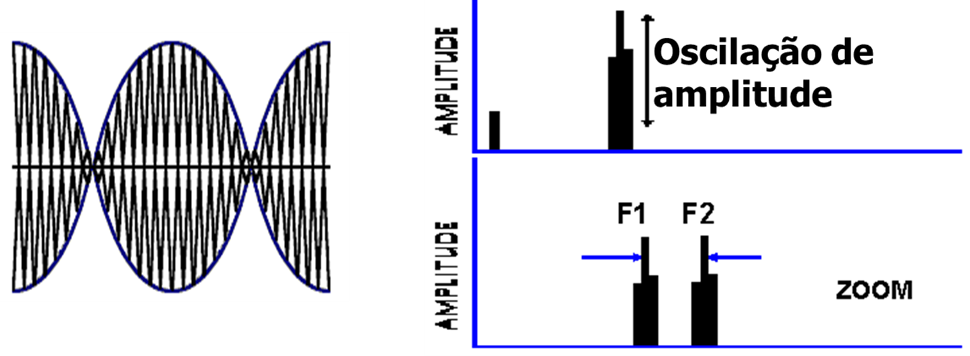
Figure 4 – Vibration level oscillation due to two frequency components with very close values
For those who are not familiar with the term slippage, there is a rotating field around the stator with which the rotor is trying to stay in phase, but the rotor will lag behind the stator field by a certain number of revolutions per minute, depending on the load. The greater the load, the greater the slip. Sliding is typically 1% rated speed at full load, and decreases to close to zero no-load slip. Since vibration levels are not constant, to measure the vibration, it is often necessary to perform what is referred to as a modulation test. In a modulation vibration test, the engine can run for a period of 10 or 15 minutes and the vibration is recorded continuously to allow the maximum and minimum to be established.
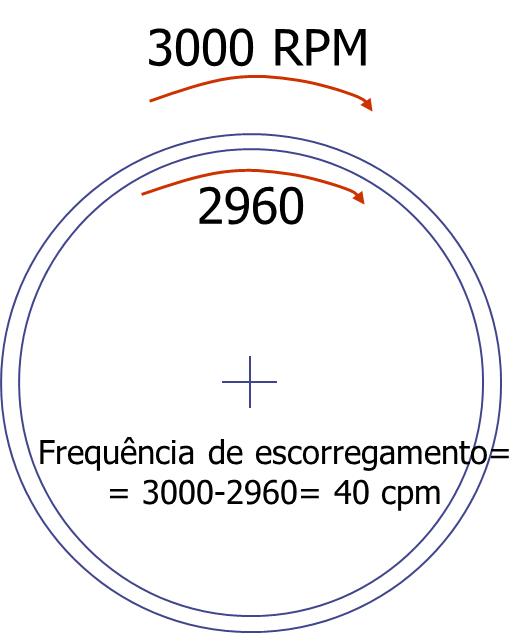
Figure 5 – the slip
1.1.3 Elliptical stator due to electromagnetic flux
For engines of 2 poles, the electromechanical force will try to deflect the stator into an elliptical shape. The main resistance to movement is the stiffness of the rotor core iron and the stiffness of the frame around the stator core., which is restricting the movement of the nucleus. us motors 4 poles, the distance between the nodes is only 45 mechanical grades, half of what happens in engines 2 poles, thus making the stator core 4 poles much more rigid to movement, resulting in a vibration at twice the frequency of the lattice, smaller. Calculations performed on a typical two-pole motor 1000 HP a 60 Hz show a vibration of 120 Hz at the outer diameter of the stator core of about 3 mm/s per second, pico, while the values for a four-pole motor of the same size are only about 0,5 a 0,7 mm/s, one-sixth to one-quarter of this amount. This vibration at twice the mains frequency is transmitted through the engine frame to the bearing housings., where its amplitude is slightly reduced.
1.1.4 vibration analysis in electric motors e fasymmetrical air gap (static eccentricity)
The vibration levels to 100 Hz can increase significantly when the air gap is not symmetrical between the stator and rotor, as shown in the figure.
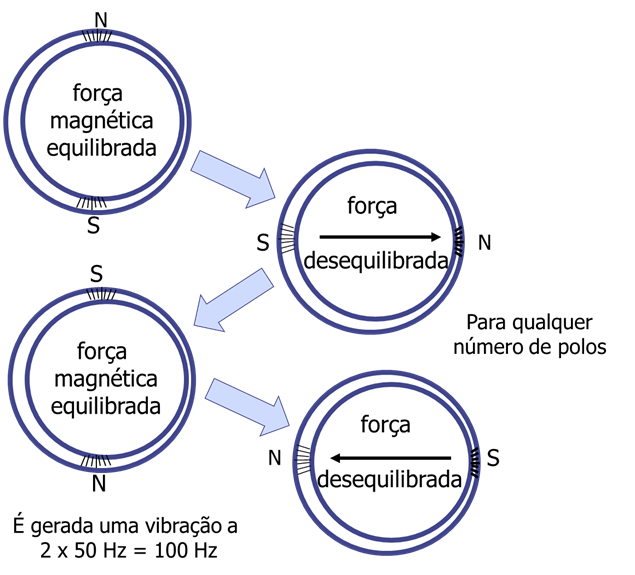
Figure 6. Asymmetric air gap around the rotor
This particular condition will cause the force to be greatest in the direction of the smallest air gap.. That is, there will be an unbalanced magnetic attraction in the direction of the minimum air gap.
Force ≈B2/d
Where:
B= Flow density
d= air gap distance
What matters here is that not only is the stator pulled in one direction, but also the rotor being pulled in the opposite direction, to the side that has the minimum air gap. This causes greater shaft vibration., what is most detrimental to bearing life. The outside diameter of the rotor being concentric with the axis of rotation, this causes the force to remain maximum in the direction of the minimum air gap.
“Pata cocha” or gaps in the bearings can cause static eccentricity.
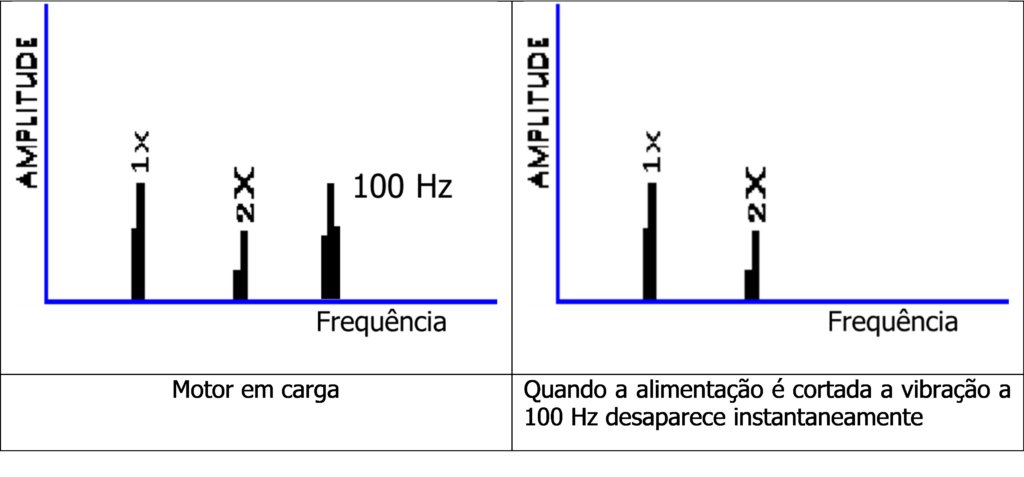
Figure 8 – What can be seen in the spectrum when the motor power is cut off. components of electrical origin disappear instantly.
1.2 vibration analysis in electric motors e a vnetwork frequency vibration (50 Hz)
Although not as prevalent as the frequency vibration of 100 Hz, there may be vibration at the mains frequency. Unbalanced magnetic impulses can result in vibration to 50 Hz, as well as in the usual vibration of twice the frequency of the network. If the rotor or stator moves from side to side, the minimum air gap point can move from one side of the engine to the other. When the frequency of this motion matches the frequency of the moving flux wave, unbalanced magnetic pull shifts from side to side with minimum clearance point, resulting in vibration at the grid frequency. this vibration to 50 Hz is usually very small or non-existent, but if the stator or rotor system has a resonance at the mains frequency, or close to her, the vibration can be great.
1.3 vibration analysis in electric motors e a vibration to 1 x RPM - Electric (eccentric rotor – dynamic eccentricity)
an eccentric rotor, which means that the outside diameter of the rotor core is not concentric with the bearing journals, creates a minimum air gap point, that rotates with the rotor, at the rotation frequency. Associated with this fact, there will be an unbalanced magnetic force acting at the minimum air gap point, since the force acting on the minimum air gap is greater than the force on the maximum air gap, as illustrated in the figure. This net unbalance force will rotate at the rotational frequency, with the minimum air gap, causing vibration at the rotational frequency.
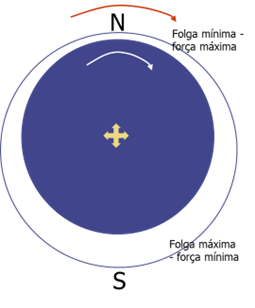
Figure 9 – eccentric rotor
The flux that causes the magnetic force is the electromagnetic flux wave., which rotates around the stator at the synchronous speed of the motor. The rotor tries to follow the rotating electromagnetic flux wave from the stator., but the rotor slips behind the stator field as needed to create the necessary torque for the load. When the high point of the rotor (minimum air gap point) aligns with the high point (maximum) of stator flux, the force will be maximum and then decrease, becoming small under a minimum flow point. Like this, an imbalance force is created that rotates at rotational speed and changes magnitude with sliding. The result is a vibration at once rotational speed., amplitude modulated by slip x the number of poles. This condition occurs at no load or at full load.. empty, frequency approaches synchronous speed and can have a modulation period of 5 a 15 minutes. full load, the modulation frequency in CPM will be equal to the number of revolutions per minute times the number of poles. Slip is equal to synchronous speed (50 Hz) minus full load speed, typically 1% of nominal rpm.
For example, a motor 2 poles with a total charge speed of 3564 rpm a 60 Hz will have a slip of 3600-3564 = 36 cycles per minute (1% sliding) and will result in a modulation frequency of 2*36 = 72 cycles per minute.
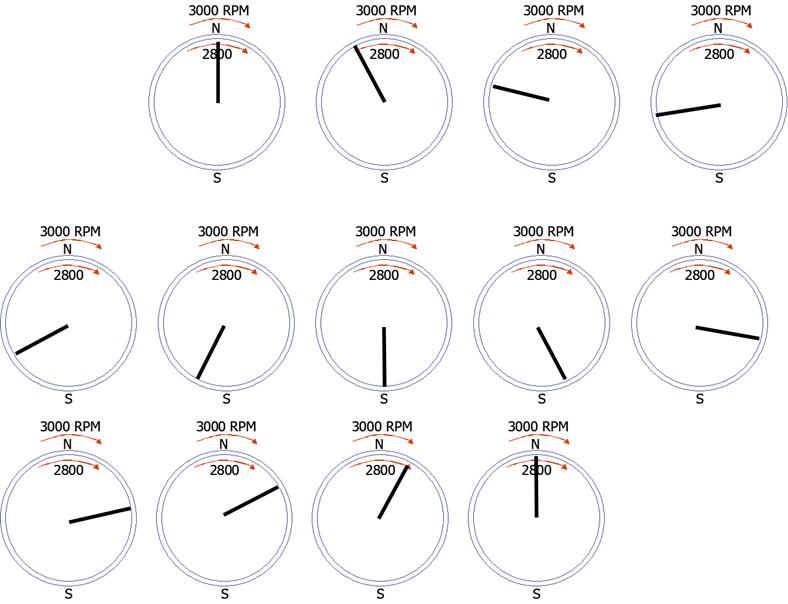
Figure 10 – In a two-pole motor, a dynamic eccentricity in the rotor, manifests itself at twice the slip frequency
The amplitude of vibration level oscillation depends on the load.
- Large and fast oscillations under load - engine roaring;
- Small slow oscillations on empty – a slip cycle can take several minutes.
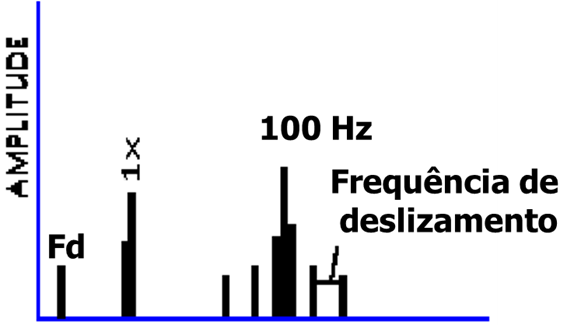
Figure 11 – An eccentric rotor causes a variable air gap (rotary) what causes pulsating vibrations.
It often takes a great deal of resolution to separate the 100 Hz of rotational speed harmonics.
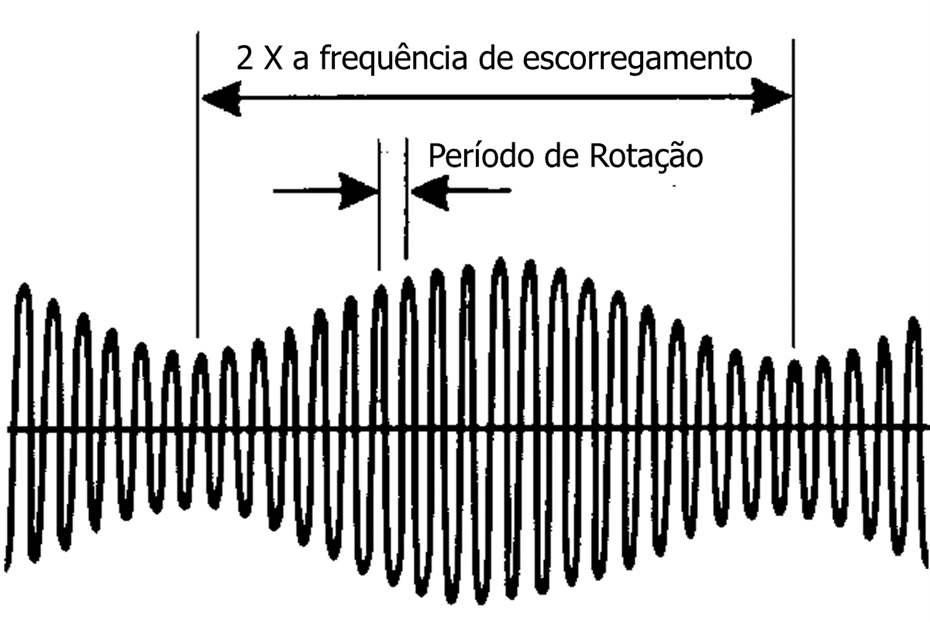
Figure 12 – The wave with the oscillation of the level of vibrations. In this case the speed of rotation is modulated by 2 x the sliding frequency.
broken rotor bar (or high resistance point)
If there is a broken rotor bar or open solder joint, no current will flow in the rotor bar, as shown in the figure. As a result, the rotor field around that particular bar will not exist. Therefore, the force applied on that side of the rotor would be different from that applied on the other side of the rotor, again creating an unbalanced magnetic force that rotates at rotational speed and modulates at a frequency equal to the slip frequency times the number of poles.

Figure 13 – broken rotor bar
If one of the rotor bars has a different resistance, a similar phenomenon may occur (as in the case of a broken rotor bar). It should be noted that this is one of the few conditions that cannot be observed in a vacuum.. However, there is an additional phenomenon associated with this condition which can be observed at no-load after the motor has been warmed up to maximum load temperature by any method that creates rotor current.
These methods include:
- Coupled full load test,
- Observation of engine heating,
- Multiple accelerations or warm-up, by locking the rotor and applying voltage.
Besides that, broken rotor bars or a change in bar resistivity will cause localized heating. This, in turn, can warp the rotor, creating an eccentric rotor, causing a mass imbalance of the rotor and a greater unbalanced magnetic pull, thus creating a one time high vibration and some two times minimum vibrations in grid frequency.
1.4 vibration analysis in electric motors e a vvibration at the passing frequency of the rotor bars
High frequency magnetic vibration, load related, at or near the passing frequency of the rotor slots, is generated in the motor stator, when current is induced in the rotor bars under load. The magnitude of this vibration varies with the load., increasing as the load increases. Electric current in the bars creates a magnetic field around the bars that applies an attractive force to the stator pits.. These radial and tangential forces that are applied to the stator pits, as shown in Figure, create vibrations in the stator core and pits.
This source of vibration is at a frequency that is much higher than the frequencies normally measured during normal vibration tests.. Due to the extremely high frequencies, even very low displacements can cause high vibration speeds, if the range of measured frequencies includes these frequencies. Although these levels and frequencies can be picked up in the motor frame and bearing housings, significant levels of vibration at these higher frequencies will not be observed between the shaft and bearing housing, where they can be harmful. For this reason, vibration test specification requirements do not normally require these frequencies to be included in the overall vibration.
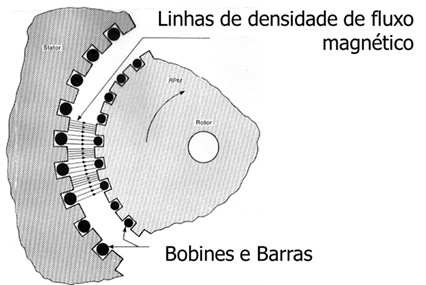
Figure 14 – Magnetic field around the rotor bar and resultant force in the stator pits
Since the vibration at the rotor bar passing frequency occurs at a high frequency, the level of vibration speed can be significant, but the effect on engine reliability is negligible. This taking into account the mechanical stress that originates in the engine as a result of vibration.. For example, Suppose a two-pole motor exhibits a vibration at 2800 Hz due to the rotor bar pass frequency plus a sideband of 120 Hz:
| velocity, (mm/s) | 2,5 | 12,5 |
| displacement (micron) | 0,28 | 1,45 |
| Stator core iron voltage | 0,2 N/mm2 | 1 N/mm2 |
| Stator pit iron voltage | 0,34 N/mm2 | 1,7 N/mm2 |
The typical fatigue strength of core iron is 240 N/mm2. Similar towing voltage levels can be calculated for all engine parts (including stator windings). Besides that, Typical minimum film thickness varies between 25 e 38 micron. Since only a small displacement can be observed, of 0,28 a 1,45 micron, as mentioned above, this vibration will not have an adverse effect on bearing performance.
The frequencies of the rotor grooves and sidebands are in the frequency range normally related to noise rather than vibration performance, and are taken into account in noise predictions during engine design. De facto, these power components are the main sources of high frequency noise in electrical machines, who have been, since some time, subject to regulations and noise limits. Experience has shown that, when noise is within normal or even high ranges, there is no associated structural damage. The meaning of these high-frequency vibrations is distorted when measurements are taken at velocity and then limits based on experience with low-frequency vibrations are applied..
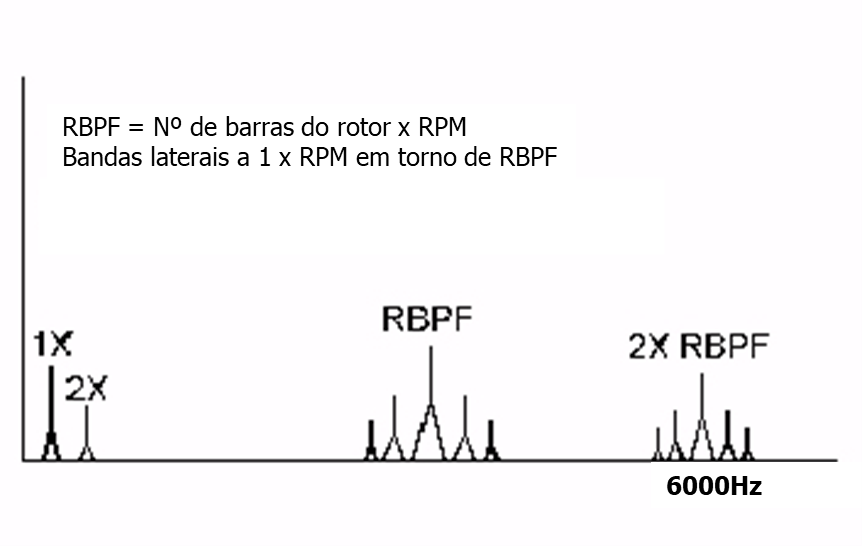
Figure 15 -The non-uniformity of the air gap also causes a vibration with a frequency equal to the bar pass frequency RBPF, with sidebands at 1xRPM of the rotor.
1.5 Electromagnetic force frequencies related to charge
The frequencies of the load-related magnetic forces applied to the stator pits and core are equal to the pass frequency of the rotor bars plus the sidebands to + or – 2f, 4f, 6f e 8fHz, where f is 50hz (network frequency). A magnetic force is generated at the passing frequency of the rotor slot (FQR), which is the motor speed in revolutions per second times the number of rotor slots, as shown in.
FQR = RPM*No / 50 Hz
Where:
FQR – rotor slot pass frequency
Nr = number of rotor slots
For the typical two-pole motor of 3570 rpm com 45 grooves in the rotor in the example above, fqr = 2680 Hz.
Sidebands are created when the amplitude of this force is modulated’ twice the frequency of the power supply. In a system of 50 Hz, the modulation of 100 Hz produces the sidebands, giving FQR excitation frequencies, FQR + 100, FQR – 100, FQR + 200, FQR – 200 Hz, etc.
Forces applied to the stator grooves are not evenly distributed to all the grooves at any instant of time.; are applied with different magnitudes in different pits, depending on the relative position of the rotor and stator pits. This results in force waves along the circumference of the stator.. The shape of these magnetic force waves is the result of the difference between the number of slots in the rotor and stator., as shown below.
M = (NS — Nr) +/-KP
Where:
NS = number of stator slots
Nr = number of rotor slots
P = number of poles
K = all integers 0, 1, 3, etc.
vibration analysis in electric motors e as fVibration forms and natural frequencies of stator vibration
Depending on the modal pattern and excitation strength frequencies, as described above, the stator will vibrate in one or more of its bending vibration modes. Each of the modal forms has its associated natural frequency.. The core can be a little influenced by the structure of the stator, but in analysis the structure is usually neglected, both because of the complexity and because the effect on higher frequency modes is minimal.
To understand the natural frequency of the stator armature in a given mode of vibration, the core can be represented as a beam, which is simply supported at both ends and bends between the ends due to forces applied to the beam. The length of the beam is equal to the perimeter of the average stator core diameter for half the wavelength of the mode.
If the natural frequency of the stator core is close to the forced frequency, the result will be a high level of vibration. Lower modes of vibration can produce resonant frequencies that are close to the prime forced frequencies..
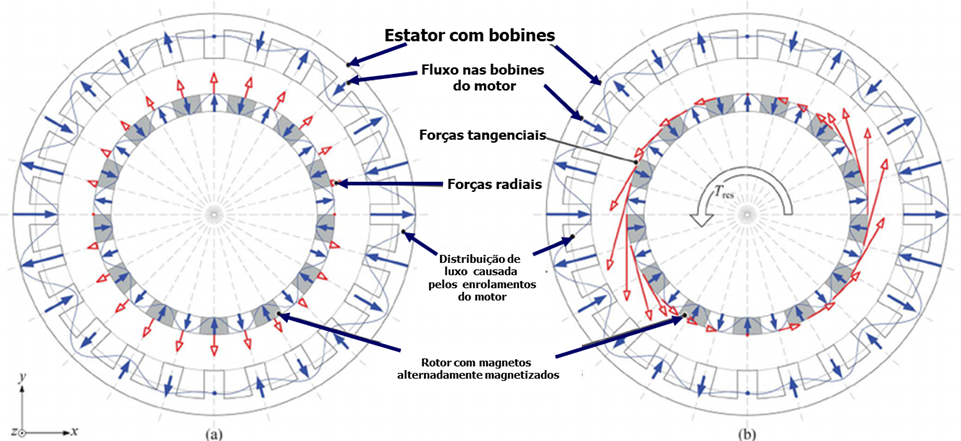
Figure 16 – Forces in stator and rotor pits
The natural frequency of the stator dips should also be seen.. Tangential forces applied to pits can cause a pit resonance condition. The pit is a recessed beam supported at the root by the core. The natural frequency of the cantilevered beam is a function of the length and width of the beam.. A longer and narrower beam will produce a lower natural frequency..
The force applied to each pit produces a displacement of the pit and core. The offset will have greater amplification the closer the forced frequency is to the natural frequency of the core or pit:

Where:
f is the network frequency
fO is the natural frequency.
this vibe is, sometimes, incorrectly associated with loose rotor bars, but there are reasons why loose rotor bars do not create rotor groove pass frequency vibration.
First of all, on most larger engines, the centrifugal forces are so great that the only time the rotor bar can move is when the rotor is accelerating. This, by itself, can be a serious problem, since the number one cause of failure to connect the rotor bar to the connector at the top, is the movement of the rotor bar as a result of multiple restarts of a high inertia load. But, the only increase in speed vibration due to loose rotor bars would be due to a displacement in the rotor cage causing a mechanical imbalance at one RPM.
why is it important when looking at speed variation in a machine, looking at any rotor bar, the bar itself is never subject to a force at the frequency of passage of the rotor slot. Bars are rotating at rotational speed. There is an alternating field in the rotor, which has a frequency close to zero cycles per minute at no-load, then increasing to a frequency equal to the slip frequency times the number of poles at full load. In an engine of 2 poles, typically 2 (poles) times 36 Rpm (typical slip) or 72 cycles per minute. To facilitate understanding, Consider a dot or bar on the rotor of a diesel engine. 2 poles, and that this point is rotating at 3564 RPM. There is a field around this bar at a very low frequency.. This field applies a force to the stator with varying magnitudes., depending on the level of flux in the rotor at that time. This flux pulses each time it passes through a stator slot.. Note that the force the rotor sees is at the stator slot pass frequency and is modulated with twice the slip. This will produce vibration of the rotor bars at the stator slot pass frequency plus and minus sideband frequencies in multiples of (slippage) x (poles).
1.6 vibration analysis in electric motors e a vibration to 1 x RPM – Imbalance
1.6.1 engine imbalance: factory manufacturing and balancing
A equilibragem is needed in all types of rotating machines, including engines, to get a smooth running machine. This operation is carried out at the factory., in a balancing machine, with a level of accuracy determined by the speed, engine dimension and vibration requirements. The highest accuracy is required for two-pole motors. Two-pole and about four-pole motors must be balanced to their operating speed on the balancing machine. The assembled motors are then tested to confirm that vibration requirements are met in service..
Factors important factors that affect the balance in the factory (mainly in two-pole motors)
Most medium and large motors are used for constant speed applications, although there has been a recent increase in the number and size used for variable speed applications in adjustable speed drives. Constant speed motors only need to be accurately balanced at a speed, its operating speed. Variable speed applications require that good rotor balance be maintained throughout the operating speed range, which can usually be 40% a 100% of synchronous speed.
The fundamental requirements for precision balancing on any machine are:
- Parts must be precision machined to achieve close concentricity and minimal imbalance individually.
- The gap of parts, which may result in dislocation during operation, causing a change in balance, should be avoided or minimized.
- Balance correction weights should be added at or near points of imbalance.
for the engines, rotor cavities must be precisely manufactured, with close concentricities of all characteristics and have a shrinkage fit on the shaft that is maintained at all rotational speeds and operating temperatures. Punches should be stacked square with the hole, evenly pressed and clamped into position when shrunk onto the shaft to prevent movement with speed change. Are made of high-strength material designed with a proper interference fit. Rotor bars are wedged and/or crimped so that they are tight in the grooves. There are other methods to ensure tightness of rotor bars., such as core heating and bar cooling, but these methods are not common. End connectors must be induction brazed symmetrically to bars, which helps to eliminate variations in balance due to thermal changes. The shaft and assembled rotor are precision machined and ground to obtain concentricities well within 0,02 mm.
Constant speed applications are usually satisfied with either a rigid shaft design, for smaller machines, either with a flexible shaft design, for larger engines. a conception of “hard shaft” is one that runs below its first lateral critical velocity, while a conception of “flexible shaft” runs above the first lateral critical speed.
Adjustable speed applications require a rigid shaft to avoid large balance changes with speed due to shaft deflection, as can occur with a flexible shaft. Besides that, However, the many other factors that affect the balance in this complex structure, discussed above, must also be controlled to maintain good balance at varying speeds. This situation is avoided by shimming the rotor bar and, sometimes, through stamping, as mentioned above. The shims around the bars, such as those used here, allow the bars to be inserted firmly into the grooves without worrying that the laminations will cut pieces of the bar, causing the bars to come loose. This design also prevents the bars from loosening over time in the field due to a similar phenomenon., that can occur during heating and cooling, where the bars may not expand and contract at the same rate as the core.
balancing procedure
When the rotor is designed and manufactured with precision, as described above, a balancing of two planes, with weight corrections at the rotor ends, is usually enough, even for flexible rotors.
Rotor balance involves the entire rotor structure, which is composed of a multitude of parts, including the shaft, the rotor laminations, the end heads, as barras do rotor, the end connectors, the retaining rings (when necessary) and the fans. These many items have to be controlled in design and manufacture to achieve a stable precision balance..
Rotor is pre-balanced without fans, then the fans are mounted and finally balanced on the rotor. Fans are individually balanced before mounting on the impeller. For engines with a heavy external fan, it may be necessary to balance the fan in two planes.
During balancing and no-load tests in the workshop, shaft extension keyway is completely filled with a crowned and contoured half keyway, held in place by a machined sleeve to prevent any imbalance from this source. The load test is carried out with the motor mounted on a solid and rigid base., accurately aligned to a dynamometer and mated with a precision balanced coupling and a suitable keyway.
Occasionally, a flexible rotor may need to balance in three planes to limit vibration when the machine passes its critical speed during start-up or deceleration. This is achieved by also making weight corrections in the central plane of the rotor., as well as at both ends.
1.6.2 vibration analysis in electric motors e o dthermal imbalance
Thermal imbalance is a special form of thermal imbalance.. It is caused by uneven rotor heating or uneven bending due to rotor heating. The proper solution is to determine the reason for uneven heating causing the shaft to bend and repair the impeller.. Before carrying out such an important repair work, it is necessary to determine the severity of the thermal situation. Reciprocating rotors show some change in vibration when transitioning from a cold state to a hot state. A API 541, 32nd edition, allows a change of 15 μm in shaft vibration (at the rotation frequency, 1X) and a change of 1,3 mm/s in bearing housing vibration. However, if the application is continuous duty and vibration levels are not excessive during start-up (that is, cold engine), it is permissible to allow a greater change from cold to hot without any damage to the engine. in these situations, if the lowest vibration levels under operating conditions are desired, a hot balancing procedure can be performed. To perform this procedure, run the engine until all conditions are stabilized thermally and quickly carry out a hot balance. if necessary, you can run the engine again after installing the initial test weights and allow the engine to thermally stabilize before taking additional vibration measurements for the final weight correction.
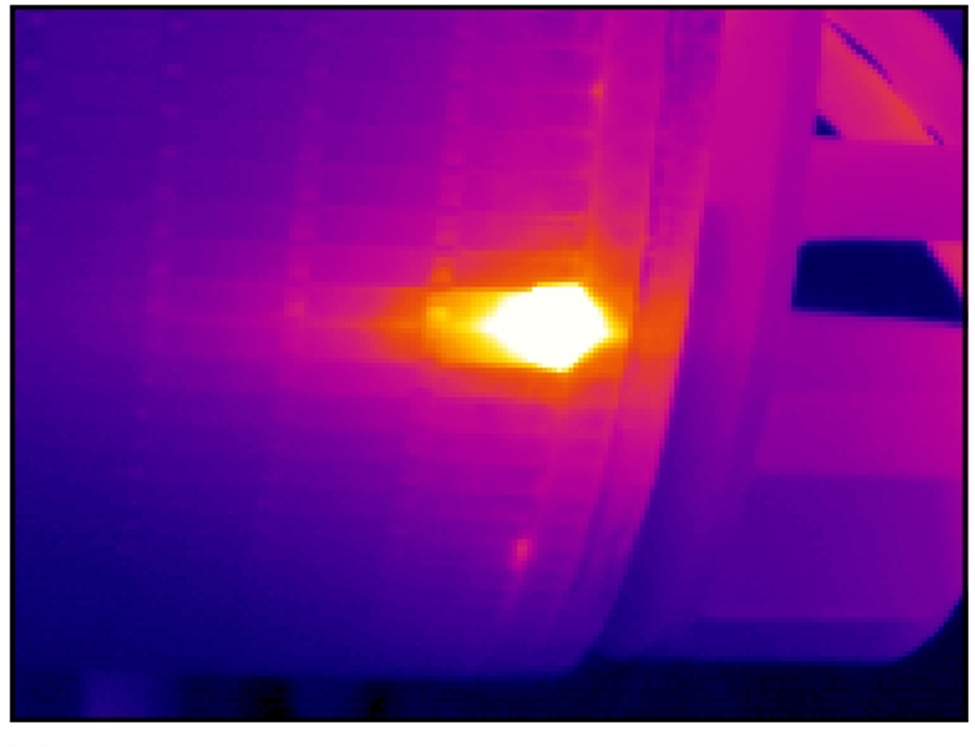
Figure 17 – Hotspot in a rotor of an induction motor
1.6.3 Coupling imbalance
The coupling unbalance limit given in API 671 of 40W/N, When applied to a typical engine 1000 HP 3600 rpm's 2 poles, for example, gives a value equal to about one third of the engine unbalance limit for one end.
Analysis shows that this would be the correct value to have a minimal effect on engine vibration.. Comparing this value with the AGMA coupling unbalance limits commonly used in the industry, is comparable to a Class balance 11 that requires a balanced coupling. It is considerably better than a Class balance 9 (by a factor of 3) that is not a balanced coupling. AGMA Class Balance Couplings 9 are sometimes used for engines 2 poles, but do not meet the API standard 671 and can cause vibration problems with precision motors.
Using a proper keyway and a balanced coupling leaves machine alignment and mounting and driven equipment balanced., like the, main factors of system vibration.
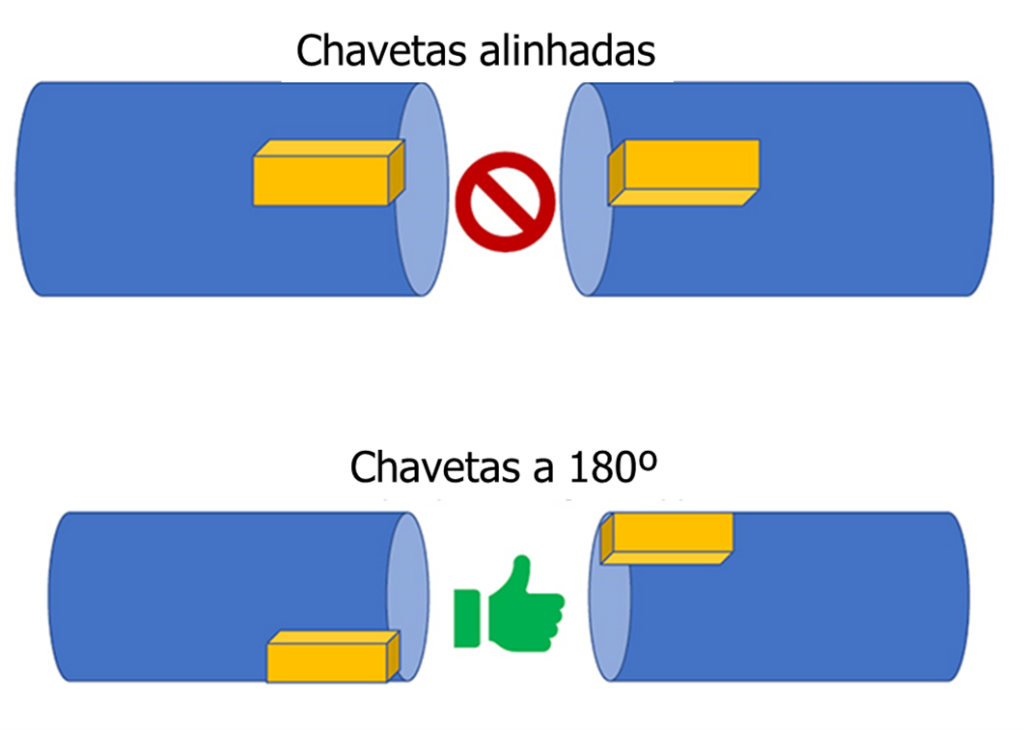
Figure 18 – Coupling imbalance
1.6.4 oversized coupling
One consideration in coupling selection is coupling size.. Coupling must be large enough to handle the application, including the required service factor, but it must not be exceptionally large. Potential results of oversize couplings are:
- Increased engine vibration due to increased coupling imbalance and/or a change in critical speed or rotor response due to increased weight. This is particularly true for flexible shaft machines..
- A very oversized coupling can result in very severe shaft bending., excessive vibration and heavy friction of seals, finally resulting in catastrophic failure of the shaft.
The predominant vibration frequency as a result of an oversized coupling would be at one rotation, such as in a condition of disequilibrium. The concept of “bigger is better” it's not true here!
1.6.5 vibration analysis in electric motors and ddriven machine balance
under normal circumstances, the imbalance of the driven machine must not significantly affect the vibration of the engine. However, if the imbalance is severe, or if a rigid coupling is used, then the imbalance of the driven machine can be transmitted to the motor.
1.6.6 Care to maintain the balance condition in the field
When a finely balanced high-speed motor is installed in the field, its balance must be maintained when the engine is coupled to the rest of the system. In addition to using a balanced coupling, the appropriate key must be used.
One way to obtain a proper keyway is to have the shaft keyway completely filled., with a full keyway through the coupling hub and the entire keyway out of the coupling crowned to match the shaft diameter. A second approach is to use a rectangular keyway of the right length., so that the part that extends beyond the coupling hub towards the motor replaces the widened open groove imbalance. This length can be calculated if the coupling hub length and keyway dimensions are known..
An incorrect key can result in a significant system imbalance., which can cause the vibration to be above acceptable limits. For example, Calculations for a typical engine 1000 HP, 2 by e 3600 rpm show that an error in the key length of 3 mm will give an imbalance of 506 g.mm. This is approximately equal to the residual unbalance limit for each rotor end of 4W/N given in the API 541 for engines, and exceeds by a factor of 3, the residual unbalance tolerance of a typical 40W/N coupling half given in the API 671 for couplings.
Occasionally, A problem arises in the field when a flex shaft machine with a high speed balance, is sent to a maintenance shop for repair. If the rotor is rebalanced on a low-speed balancing machine in the maintenance shop, this usually results in imbalance in running speed and the machine will malfunction when tested or reinstalled. The solution, obviously, is not to rebalance unless absolutely necessary due to the nature of the repair. If rebalancing is absolutely necessary, must be carried out at the operating speed of the rotor; otherwise, it may be necessary to perform a trim balance after engine reassembly.
1.7 vibration analysis in electric motors vforced response ibration
1.7.1 vibration analysis in electric motors e a bweak engine bay
If the engine is on a steel base manufactured, such as a sliding base, then there is a possibility that the vibration that is measured in the motor is greatly influenced by a vibrating base. ISO standard, the base must be sufficiently rigid to meet the criteria for “massive foundation” defined by API 541. Essentially, this requires that the vibration of the support near the motor feet be less than 30% from the vibration measured at the engine bearing.
To test a weak base, measure and plot the horizontal vibration at ground level, na base, in the middle and at the top of the base, and in the engine bearing.
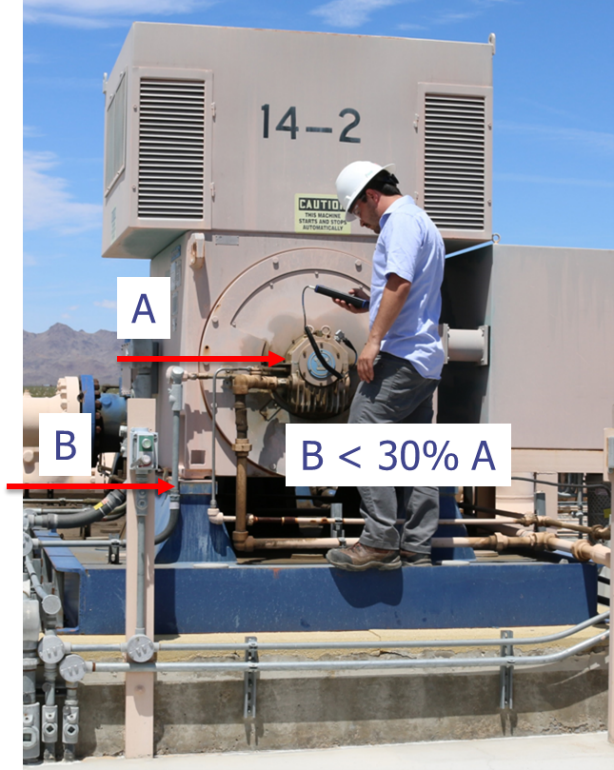
Figure 19 – Engine base vibration
A weak engine base typically results in 1x high vibration, normally in the horizontal direction. However, can also result in a 2X high vibration (twice the rotation frequency) or 2f (twice the line frequency), which is also a common vibration frequency in motors. To determine the nature and source of this 2x high vibration, it is necessary to carry out vibration measurements on the motor feet, both vertically and horizontally, taking phase and amplitude into account to determine a modal shape. O “rocking mode” of the engine observed in a particular case is illustrated below. The horizontal component δHV due to balance it adds to δHM engine inherent to give a high total in the bearing housing, as shown by the equivalence below.
dH=dHM+dHV
in which:
dH = Actual horizontal vibration of the engine measured on the ground
dHM = Horizontal vibration of the isolated motor measured on a solid base in the workshop
dHV = D/E * VB calculated horizontal vibration
component due to δVB, vertical vibration measured at each engine foot in the field.
The recommended repair for the weak engine base is that the support beams be bonded together and heavily reinforced with the intention of meeting the criteria for a “massive foundation”. Even when base resonance is not a factor, reinforcement of a lightweight support structure can greatly reduce vibration.
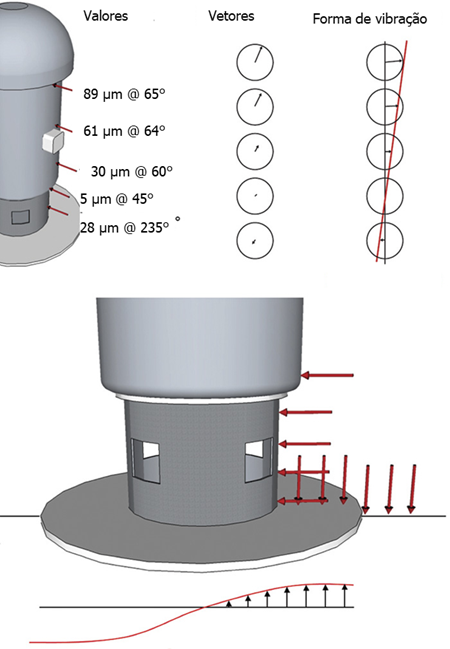
Figure 20 – Oscillation mode due to a weak base
1.7.2 vibration analysis in electric motors e a fstructural natural sequence
The structural natural frequency of a vertical motor is a function of its mass, mass distribution and base geometry. Structural natural frequency should not be confused with lateral critical motor rotor speed. However, on large vertical motors, the lateral critical speed of the rotor can be a determining factor in the structural natural frequency, particularly from the engine alone.
The effect of the rotor can be determined by considering it as a separate mass and including the flexibility of the rotor shaft in the calculation of the structural natural frequency.. That is, The engine is considered to be a two-mass, two-degree-of-freedom system., instead of a single degree of freedom system, as described in the standard NO MG 1-20.55. The engine structure is basically a two-mass system that can be progressively simplified., first for a beam-mass frame scheme, then to an equivalent system of two masses and two springs.

Figure 21 – Vibration modes of the structure of a vertical motor in resonance
When the critical lateral rotor speed is less than the structural frequency calculated as a single degree of freedom system, the true structural frequency will be lower than the calculated one. However, when mounted on a flexible base in the field, the effect of rotor shaft will be minor and a single degree of freedom calculation is generally adequate. As in the case of a side critic, if the operating speed of the engine (or any other frequency at which a forced function is present) match the structure critic, there will be a large amplification in the amplitude of the vibration. Engine manufacturers regularly issue critical structural frequency data. This includes the natural structural frequency that the motor alone would have if it were mounted on a rigid seismic mass..
Besides that, The motor manufacturer provides the following information to help determine the resonant frequency of the system with the motor mounted on the user base:
- machine weight,
- Location of the center of gravity
- static deflection.
The bases found in typical installations are not as rigid and, consequently, the critical frequency of the structure will be lower. If the natural frequency of the structure drops to a frequency at which there is a forcing function present (normally the speed of rotation), the critical frequency of the structure will have to be changed. Normally, this is not difficult to do and is often achieved by changing the stiffness of the base or changing the weight of the base/motor. When the natural frequency of the structure drops below the operating speed to about 40% a 50% of operating speed, this can result in subharmonic vibration at system resonance speed in motors with anti-friction metal bearings. This could be due to oil whip effects. (oil whip) or an inadequate oil film on the guide bearing.
1.7.3 vibration analysis in electric motors e a bresonant ase
If the engine operating speed (or any other frequency where a forcing force is present) match the resonant frequency of the base, there will be a large amplification of the amplitude of vibration. The only solution to this problem is to change the resonant frequency of the base. Normally, this is not hard to do, and is often achieved by changing the stiffness of the base, or changing the weight of the base/engine.
1.7.4 vibration analysis in electric motors e a vbearing-related ibration
Machines with anti-friction metal bearings may occasionally experience vibration. “To easily detect this phenomenon, it will be convenient to have Reference Spectra”, which occurs at a frequency of approx. 45% of operating speed. This value can be quite high., particularly if there is a critical speed equal to or less than 45% of operating speed, which is referred to as a condition of “oil whip”. In addition to basic bearing design considerations, that will not be addressed here, a common cause is high oil viscosity due to low oil temperature in flood lubricated engines operating in cold ambient conditions. Similar subharmonic vibrations, but of low amplitude, may occur in ring-lubricated bearings, probably due to marginal lubrication. Other causes of vibration are the lack of roundness of the journal or misalignment of the bearing..
As Bearing bearings have the typical defect frequencies. These default frequencies are for the inner lane, to outer court, the rotation of the spheres (or rolls) and the fundamental cage train. Much research has proved that it is not possible to give an absolute answer to the allowable amplitudes at bearing defect frequencies.. Therefore, The most important aspect to take into account to indicate significant bearing wear is the presence of several frequency harmonics from bearing defects, especially if they are surrounded by amplitude-independent sidebands. The monitoring of vibrations must be carried out from the installation, looking at these indicators to predict the remaining life of the bearing.
2 ANALYSIS OF VIBRATION IN ELECTRIC MOTORS –IDENTIFICATION OF THE CAUSE OF THE VIBRATION PROBLEM
2.1 Monitoring vs.. Instant Measurement
A snapshot measurement refers to obtaining spectral vibration data at an instant in time.. The details of amplitude vs.. frequency are readily available in this format..
One monitoring refers to the collection of vibration data over a period (typically ten or fifteen minutes), so that the variation of vibration as a function of time can be analyzed.
Recommendations for instantaneous measurement, with a data collector, are the following:
- Current technology makes it possible to differentiate problems of electrical origin from problems of mechanical origin.. The fundamental aspect to differentiate the origin of these problems is found in the capacity of analysis with a great number of spectral lines of resolution and, in some cases, in the capacity of “zoom” of the FFT analyzer.
- It is necessary to clearly visualize in the spectrum the vibratory activity around the rotational frequency of the rotor, clearly distinguishing the frequency corresponding to twice the network frequency of the rotor speed harmonics
- A good spectral resolution will also allow differentiating problems at high frequency of electrical origin from those of mechanical origin., as would be the case of a mechanical defect in a bearing.
- Dynamic analysis of the rotor in the 0 a 200 Hz, com 1600 resolution lines and 4 media. Recommended band analysis parameters:
- rotor speed, between 0.8xRPM and 1.2xRPM
- network frequency, between 49,5 Hz and 50,5 Hz
- 2xFl (network frequency), between 99,5 Hz and 100,5 Hz
- Rotor eccentricity analysis in the 0 a 3000 Hz, (bar frequency+400 Hz), com 3200 resolution lines and 4 media. recommended parameters:
- rotor speed, between 0.8xRPM and 1.2xRPM
- network frequency, between 49,5 Hz and 50,5 Hz
- 2xFl (Network Frequency), between 99,5 Hz and 100,5 Hz
- Number of Bars +/- 0,5 RPM do rotor
- Number of Bars +/- 2x Network frequency
- No. of Slots +/- 0,5 RPM do rotor
- No. of Slots +/- 2x Network frequency
Typically, the following frequencies are monitored when monitoring: 1/2X, 1X, 2X, e 50 Hz, 100 Hz, and overall vibration levels (i.e. unfiltered), where X corresponds to the rotation frequency.
Additionally, phase information must be monitored when monitoring is carried out, especially for the rotation frequency of one time. This will make it possible to identify and subsequently correct various vibration problems..
Sometimes, it is desirable to separate the vibration to 100 Hz and twice the rotation frequency. Different methods are needed to do this at no load and at full load. at full load, the frequency difference is large enough that the separate components can be measured directly with most vibration analyzers. However, in empty, the frequencies are so close to each other that this cannot be done, even using zoom mode on a high resolution analyzer, so an indirect method is needed. This can be achieved by measuring the value 2 x RPM at reduced voltage (25%) where the component 2 x line is insignificant, and then subtracting it from the component 2 peak x in the monitoring test which is the sum of the components 100 Hz and 2 x RPM. Normally, this is only possible on the premises of an engine manufacturer or in an engine maintenance shop.
2.2 Troubleshooting procedure
If a vibration problem occurs, there are several tests that must be performed. But, first of all, the following maintenance items should be checked.
maintenance actions
- Check for loose screws – assembly or other loose parts
- Keep the engine free of dirt or debris
- Check for proper cooling and inlet temperatures or for obstructions, such as rags, fluff or other wrappings
- Check bearing and stator temperatures
- Lubricate as recommended
- Check for correct oil levels
- Periodically check for vibration and record
- All screws are tight? The thigh leg has been eliminated?
- Hot alignment is suitable? If it is not possible to check the hot alignment, cold alignment has been checked (with suitable thermal compensation from cold to hot)?
- some piece, box top cover, pipe is vibrating excessively (that is, some part connected to the engine is in resonance)?
- The foundation or structure on which the engine is mounted is vibrating more than 25% from engine vibration (that is, the motor base is weak or resonant)?
- Integrity of fans and couplings – fan blades are corroded/broken, coupling bolts are loose/missing, coupling lubrication is satisfactory?
If all of the above items are satisfactorily verified and the vibration remains high, a complete vibration analysis will be required.
Essentially, there are only two steps in diagnosing a problem:
- Get vibration data – not always clear due to noise, side bands, sign combination, modulation, etc.
- Determine which conditions increase, decrease or have no effect on vibration across different test conditions to help isolate the root cause.
vibration analysis in electric motors – tests to be carried out
ISO standard, vibration measurements should be taken with the engine running under the following conditions:
| load condition | Coupled | Tension | comments | Comments |
| with load | Sim | 100% | First measurement to be obtained. It represents the state of the machine in actual operation. It can indicate which test to carry out next. | All conditions stabilized (i.e. normal operating conditions) |
| No charge | Sim | 100% | Removes vibration related to load, while everything else remains the same. It is not always possible to reach zero charge, but it is usually possible to reduce the load. | |
| No charge | No | 100% | Removes all effects from coupling and driven machine. Isolates motor/base system. | |
| No charge | No | 25% | The effect of magnetic pulling forces is minimized (the most effective use is compared to vibration at full voltage, 25% usually only possible at the engine maintenance shop or at the engine manufacturer's premises. If the motor is a Y-A connected motor, then the Y connection effectively has 57% voltage compared to connection to the same terminal voltage. A comparison of the vibration in both links, will reveal the sensitivity of the motor to voltage. | |
| No charge, at stop | No | 0% | It will make any critical speed/resonance issues evident to the entire motor/base/driven equipment system. Observing the change in vibration when motor power is cut will give similar information as operating with reduced voltage, as illustrated in Figure 16. |
- Data must be acquired in the frequency domain and time domain.
- during deceleration, one waterfall chart will provide data in the frequency domain (vibration spectral data) versus speed, which can be very useful.
- One bode chart will produce amplitude and phase vs.. velocity.
- It is understood that the voltage 25% not readily available in the field. Reduced voltage vibration measurement is one of the most powerful methods available to separate electrically induced vibration. (which manifests itself at twice the frequency of the network) mechanically induced vibration (which manifests itself in twice the speed of rotation) on two-pole motors. Therefore, the method has been included.
Behavior under various conditions
The following table shows the expected vibration behavior of an engine under different conditions..
The following figure shows the expected vibration behavior of a motor, when the power is cut.
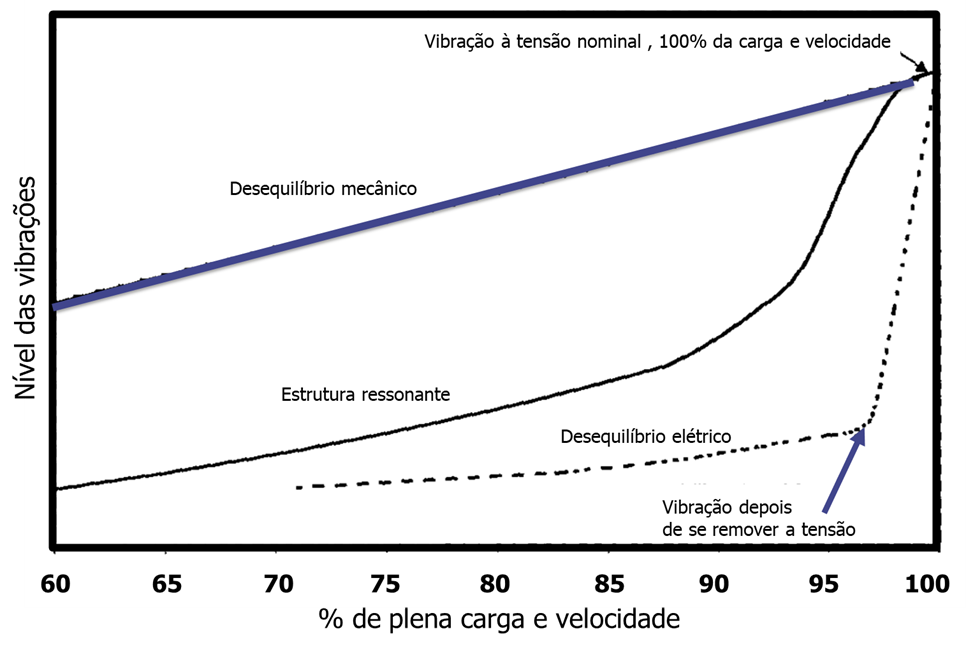
Figure 22 – Evolution of vibration when power is cut off
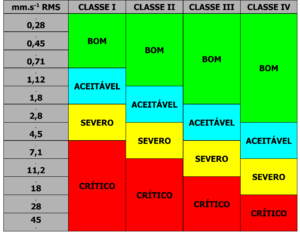
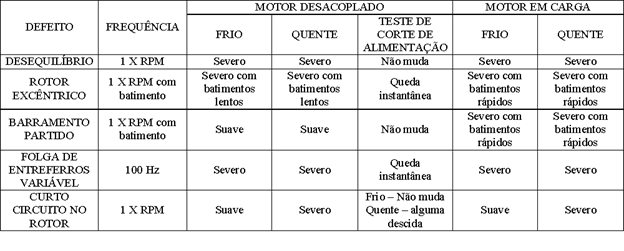
3 DIAGNOSTIC TABLE FOR VIBRATION ANALYSIS IN ELECTRIC MOTORS
| Cause | Vibration frequency | Phase angle | Amplitude response | Power cut | comments |
| Bearing misalignment | Mainly 2 x Some 1 x High Radial on Drive and Axial Side | The phase may be unstable | Stable | Slowly decreases with speed | 2 x can dominate during deceleration. 2 x is more predominant with greater misalignment |
| Coupling misalignment | Mainly 1 x High Radial on Drive and Axial Side | 1800 phase out between the two sides of the coupling | Stable | The level slowly drops with the speed | Parallel causes radial forces and angular causes axial forces. Load dependent. |
| Friction Sealing/or Bearing | Can be seen 1/4x, 1/3x, 1/2x or 10-20x Mainly 2 x Some 1 x. radial. | Unstable | Unstable depending on gravity. | Disappears suddenly at a slower speed. | Complete frictions tend to be 10 a 20 times higher. Bearing misalignment can cause friction symptoms |
| Rotor friction | Can be seen 1/4x, 1/3x, 1/2x and 1x with sidebands at frequency. Radial slip. | Unstable | Alta | Strong blows | |
| I desaperto: bearing (non-rotating) | Can be viewed 2x, 3x. Radial | Stable | Floats | Disappears at a slower speed | Clearance in the bearing seat. Clearance in bearing separation |
| I desaperto: Core to rotor (rotary) | 1 a 10x com 1, 2 e 3 predominant. Radial | May exist depending on the type of looseness The overall loose core gives an erratic symptom | Unstable, high level | Falls quickly. May disappear suddenly. | Loose end plates. Loose Core Inner Diameter. |
| I desaperto: Pedestal (non-rotating) | 1 a 10x com 2 e 3 predominant. Radial & Axial | Stable | Floats. | Disappears at a slower speed | |
| I desaperto: External fan | Radial e Axial, fan side | N/A | Floats. | Drops with speed. May disappear suddenly. | |
| Rotor imbalance | 1x RPM Radial | Free side and phase drive. Coupling gives out-of-phase condition | Stable | The level drops slowly. | unbalanced rotor – could be due to thermal problems. |
| External fan imbalance | 1x Raised radial on fan side. 1x Raised axial on fan side. | Coupling side out of phase 1800 with the machine running, coupling side. | Stable | The level drops slowly. | |
| Unbalance Coupling | 1x radial and top on drive side | Stable | The level drops slowly. | Unbalance due to coupling or key | |
| Bent shaft extension | mainly 2x can be seen 1x Axial | 1800 out of phase on both sides of the coupling | Stable | The level drops slowly | The eccentricity of the drive side must originate 2x axial at that end. Normal displacement in the nucleus – 20 a 50 micron |
| Eccentric air gap | Strong 100 Hz Radial | N/A | Stable | Disappears instantly | The difference between maximum and minimum air gap divided by the average must be less than 10%. |
| Thigh foot Eccentric rotor. | 1xrpm mostly some 50 e 100 Hz Radial | Unstable | Modulates in amplitude with slip | Disappears instantly | eccentricity limit 20 a 50 micron Slip beat changes with speed/load. |
| Loose stator core. | 100 Hz. Axial e radial (ver no envelope) | Structure and bearing in phase a 100 Hz | Stable | Disappears instantly | Check the relative movement of the stator core in relation to the structure. |
| Empeno do rotor (thermal origin) | 1x Mainly Some can be seen 100 Hz Can have modulators at 1X and 2X vib. Radial | Unstable | Changes with the temperature. Related to the weather or the frog. Varies with freq. slip x poles | some fall, but the high level would fall with the speed | related to heat. Examine rotor to see if sheet stack is unevenly tightened or loose. Short circuit in the rotor Check that the rotor bars are loose |
| Broken rotor bars | 1x and modulated by the slip x n. poles. May have high stator slot frequencies | Depends on where the broken bars are located. | POSSIBILITY OF STRONG BEATING. Varies depending on frequency. sliding x poles – Amplitude increases with load | Disappears instantly | Sparks may be observed in the air gap. Long-term variation of stator slot frequencies can be an indicator of bus problems. Broken bars cause voids in the magnetic field. Large current fluctuations. Current analysis shows slip frequency sidebands. |
| Loose bars | 1 x Possible balancing effect with thermal sensitivity. Radial Freq. of stator slot plus sidebands at ±(nº. Poles*Slip) | The vibration to 1 x will be stable The frequency of the stator slots will be modulated causing a fluctuation in the phase angle in the overall vibration | Stable | The stator slot frequency will disappear immediately. The imbalance effect may disappear suddenly at a lower speed. | Excessive loosening can cause balance problems in high-speed motors. |
| Degradation of insulation between phases | 50 & 100 Hz Radial | N/A | Stable and possible beating | Disappears instantly | |
| Earth damage | 50 Hz & 100 Hz Bar Frequencies – Radial | Stable and possible beating | Disappears instantly | ||
| Supply voltage imbalance | 100 Hz Radial | 100 Stable Hz and possible beat | Disappears instantly | ||
| Electrical noise vibration | (RPM x number of rotor holes)/60 +1-100, 200, etc. – Radial | Due to modulation, the global vibration will fluctuate | Stable | Disappears instantly | Increases with increasing load. |
| System resonance | 1 x RPM or other forced frequency. A plane — usually horizontal | Varies depending on load and speed | Varies | Disappears quickly | The foundation may need to be reinforced – may involve other factors |
| Effort | 1 x RPM | Stable | Caused by distortion of the shell or foundation due to the attached structure (piping). | ||
| Deformed bearing housing | 2x RPM normally | Unstable | Stable | May disappear at low speed | Can act as a friction. |
| Oil film instability (To easily detect this phenomenon, it will be convenient to have Reference Spectra) | Approximately from 0,43 a 0,48 RPM | Unstable | Stable | ||
| Bearing problems | Various bearing frequencies | Unstable | Stable | four basic frequencies. | |
| Resonant Parts | At forced frequency or multiples | N/A | Stable | Disappears quickly | Can be adjacent parts |
| Top cover adjustment | 100 Hz radial | Stable | Disappears instantly | Expansion of 100 electrical Hz. The top cover rests on the basic core support. |
Case 1 – Paw Assay for thigh-identification conditions as a cause of eccentricity situations in Static Induction Motors AC
this essay, accomplished, common vibration analyzer and the engine is running under normal operating conditions, It aims to identify the existence of leg-thigh conditions that often are the source of the static eccentricity between iron AC induction motors. That way, intended to eliminate excess vibration that this problem may generate, increasing life two components, preventing unscheduled stops due to premature deterioration or even breakage of some of the engine components or coupling union.
Example test performed on an engine
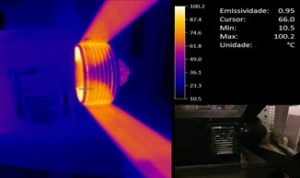
An engine running at 2964 presented rpm vibrations above the established limits for this type of equipment. The results of vibration analysis in electric motors observed that predominated in the spectrum the second harmonic frequency of the electrical network (100 Hz). The filtered amplitude had a value 6,7 mm/s RMS. this feature, illustrated in Figure 1, It is caused by an eccentricity static condition in the air gap.
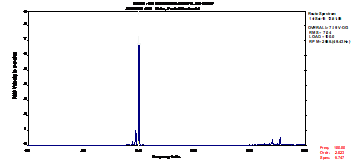
Figure 23 - frequency spectrum recorded during routine measurement
Measurements after unscrewing paws
After loosening the first motor paw, We observed that there were no major changes in the spectral characteristics, namely, the amplitude of frequency 100 Hz (Figure 2).
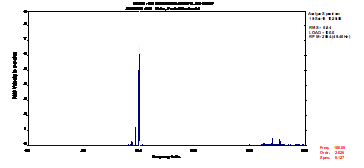
Figure 24 - Frequency Spectrum recorded after unscrewing the front paw on the left
The most significant changes in the amplitude of the second harmonic of the frequency of the power grid occurred when unscrewing the back of the left leg and when unscrewing the front leg on the right side. In the latter case, the amplitude of the frequency dropped to 0,2 mm/s RMS. In the figure 3, registered frequency spectra are shown after loosening each of the four paws engine where one can observe significant changes in the amplitude of the frequency 100 Hz.
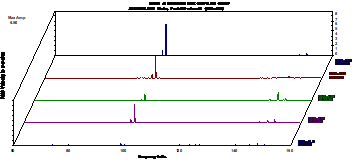
Figure 25– Frequency spectra recorded after loosening each of the four paws
With the test done, It was possible to identify objectively, vibrométricos that elevated levels in the presence engine were associated with leg-thigh condition that originated static eccentricity between the motor iron. The correction / deletion paw-thigh will greatly reduce vibrométricos levels at which the engine is submitted, reflecting on increased component life.
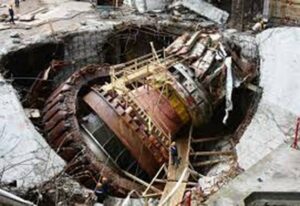
case study 2 –vibration analysis in electric motors – Analysis resonance vibrations in the drive of a pulper
A vertical engine that drives a pulper via belts, such as shown in Figure 4, com 600 kW of power and 1000 rpm, after the assembly and general improvement, It showed high levels of vibration voted, As shown in Table I below presents.
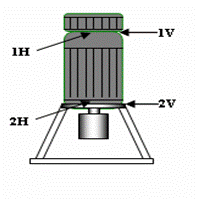
Figure 26 – Scheme equipment with the location of the measuring points
First measurements
The vibration analysis results in electric motors, shown in Table I, It reveals that the recorded levels are vibrométricos, mostly, considered "Severe" according to the evaluation criteria adopted. Only the engine support, side pulley, according to the measurement and directions Vertical Axial, vibrométricos the levels are considered good / acceptable. data collected and presented in Table I., It reveals that the recorded levels are vibrométricos, mostly, considered "Severe" according to the evaluation criteria adopted.
Table I
Measuring point | Global Vibration levels (mm.s-1 RMS) |
point 1V | 8,8 |
1H Point | 7,7 |
point 2V | 1,1 |
Point 2H | 5,5 |
2a | 2,3 |
In support of the engine, side pulley, The data presented above show a significant difference between the amplitudes vibrométricas recorded in two radial measuring directions (Vertical and horizontal). The spectral analysis performed showed that vibration levels are present in the engine, about everything, influenced by the operating frequency range (1xRPMmotor=16,65 Hz). This condition is illustrated in the frequency spectrum shown in Figure 5.
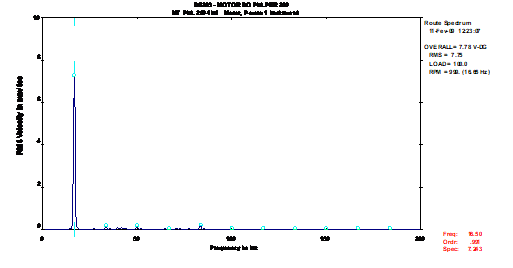
Figure 27 – Analysis resonance vibrations – frequency spectrum collected on the motor support opposite the drive, horizontal direction
Given the asymmetry revealed by vibrométricos levels observed between the two radial measuring directions (Vertical and horizontal), the data presented so far were inconclusive as to the cause for the dynamic behavior registered.
Measurements in transient regime
In order to confirm the existence of conditions of resonance, Assays were performed in transitional regime, to determine the natural frequencies of the system.
The tests performed revealed in the horizontal direction at a natural frequency 919 CPM, due to the variation of the phase angle between about 90 919 CPM and 999 CPM. this feature, illustrated in Figure 6, shows a resonance condition, due to the fact that the natural frequency is close to the engine operating frequency (1000 CPM).
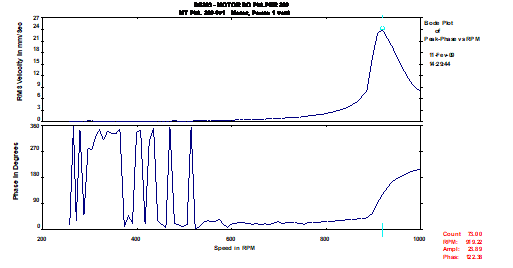
Figure 28 – Analysis resonance vibrations – Bode diagram taken in the horizontal direction
Recommendations made
Depending on the data collected, It was recommended rectification motor support base and the slide rails of the belts.
Measurements after repair
After rectification of the bases and the reconstruction of massive, was a new measurement performed, whose values are shown in Table II.
Table II
Measuring point | Global Vibration levels (mm/s RMS) |
point 1V | 1,6 |
1H Point | 2,1 |
point 2V | 0,3 |
Point 2H | 1,5 |
2a | 0,4 |
Comparing the values shown in Tables I and II, There has been a significant improvement in vibration levels. The spectral analysis performed showed that the improvement is, about everything, due to the reduced range of motor operating frequency (16,59 Hz), As can be seen in the spectra shown in Figure 7.
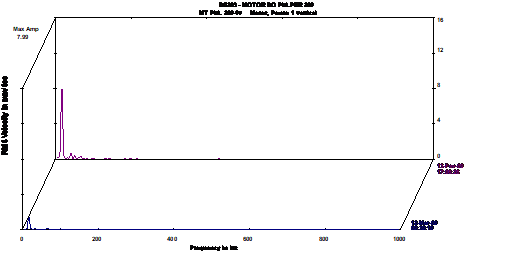
Figure 29 – Analysis resonance vibrations – Spectra of frequencies collected at the point 1 Vertical, before and after the intervention on the whole support base
In order to justify the improvement, Two tests were performed in transitional regime (in the vertical direction and the horizontal direction according to), to determine the natural frequencies of the system (Figure 8 e 9).
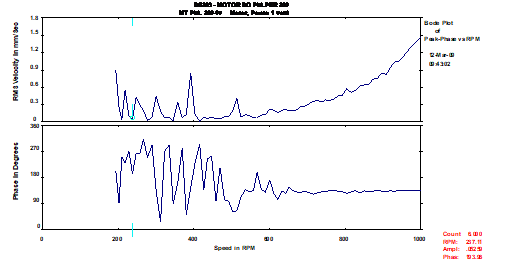
Figure 30 – Analysis resonance vibrations – Bode diagram taken in the vertical direction
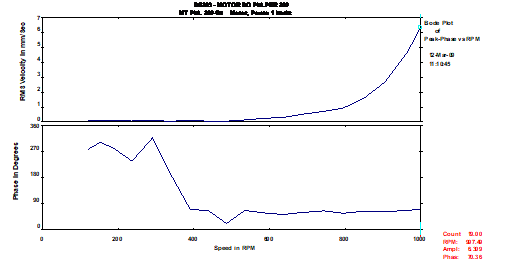
Figure 31 – Analysis resonance vibrations – Bode diagram taken in the horizontal direction
-Conclusão resonance vibrations Analysis
The inspection carried out concluded that the cause of the high levels in the presence vibrométricos the machine was associated with a resonance condition, caused by the proximity of the natural frequency of the system and the motor operating frequency (1xRPM).
As found in this case, MRI is one of the causes that may lead to high amplitudes 1xRPM. But not only: other abnormalities / damage not only the imbalance, can give increased amplitude 1xRPM, as surely we will be able to address in future issues of this Newsletter.
case study 3 – Analysis resonance vibrations in an electric motor
We are quite often we are asked about the causes that are behind some atypical behavior of rotating machines. Today, with the "pressure" to reduce energy costs, is quite often we find driven motors with frequency inverters. This trivialization can, in some conditions, cause certain problems in the equipment. One of the most common problems, from other, is that these machines that operated with low vibration values (without variator), go to vibrate more at some speeds (with speed variation). The data that follow are presented below, They were collected in a pump identical to that shown in Figure 10.
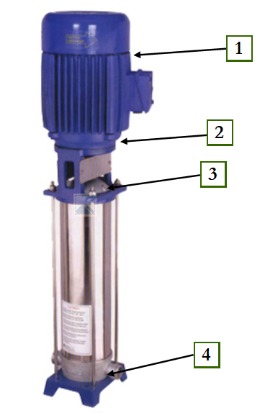
Figure 32 —Photography of the equipment with the identification of the measurement points
initial measurements
Analyzing the values presented in Table III, We found that the vibration values registered in the machine to speed 1121 rpm, They are clearly superior to the values collected when the engine was at maximum speed (1479 rpm).
Table III
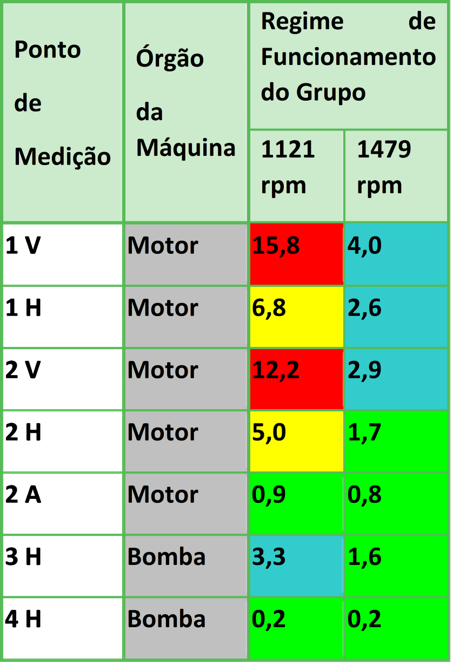
Like this, easily conclude that the slower speed (1121 rpm) The levels are higher vibrométricos, compared to values recorded at higher speeds (1479 rpm). This behavior may be considered atypical because the machines tend to vibrate more, as the rotation speed is higher.
The spectral analysis performed to the collected elements, revealed that the majority of the measuring points, the severity recorded at a speed of vibrométrica 1121 rpm was, about everything, due to the operating frequency range of the group (18,68 Hz). this feature, illustrated in Figure 11, imbalance arises normally associated with.
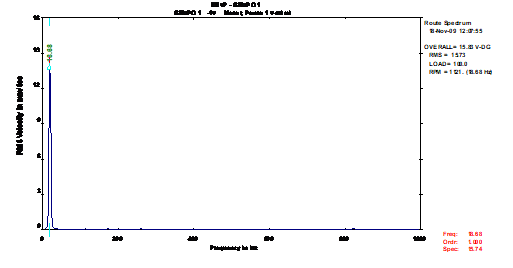
Figure 33 – Analysis resonance vibrations – Frequency spectrum collected at point 1 Vertical
Yet, analyzing the figures in detail we can see a significant difference in values, between the two measuring directions (V- Vertical e H- Horizontal).
this difference, associated with the fact that, with increasing speed vibration values decrease (the opposite situation to an imbalance condition), It led us to suspect that the equipment might be a resonance condition.
further testing in the vertical direction
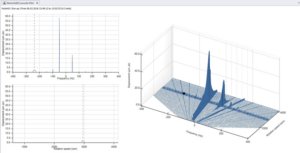
Additional tests carried out, namely the realization of impact instrumented test hammer, They revealed the presence of a natural frequency 18,8 Hz (1128 cpm) according to the direction Vertical (Fig. 12).
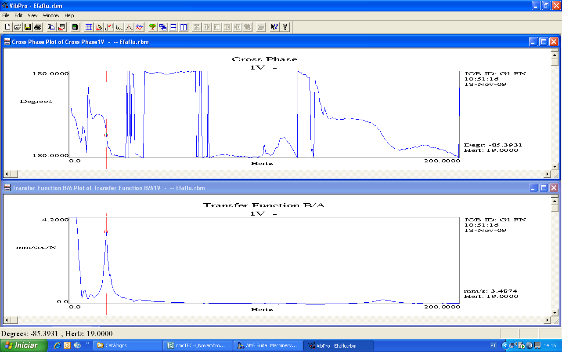
Figure 34 – vibration analysis in electric motors – Analysis resonance vibrations – Figure transfer and phase angle function recorded during impact with the instrumented test hammer (Vertical direction)
further testing in the horizontal direction
Toward Horizontal, The same tests also revealed a natural frequency 20,5 Hz (1230 cpm), As can be seen in Figure 13.
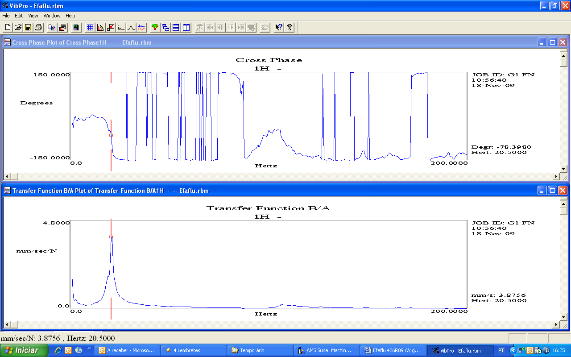
Figure 35- vibration analysis in electric motors – Analysis resonance vibrations – Figure transfer and phase angle function recorded during impact with the instrumented test hammer (Horizontal direction)
Alongside these frequencies, also confirms a phase angle range of about 90 (characteristic resonance condition).
Considerations on the outcome of the tests
With the completion of the impact testing, It was possible to determine the natural frequencies of the system, and conclude that high levels vibrométricos that the equipment was submitted, when he was running the 1112 rpm, were generated by a resonance condition according to the horizontal direction.
Resonance occurs when one of the vibrational frequencies in the presence on the machine (often forced) It is close to the natural frequency of the system.
In other words, we could say that a resonance condition is not more than the coincidence of the encounter between two frequencies (the natural frequency of the system and one of the vibrational frequencies in the presence on the machine). These frequencies are always present in machines and only become a problem when they are close to each other.
Notes on Resonance
It should also be noted that, often, prior to characterize these resonance phenomena, most responsible for equipment try to minimize vibration levels, making successive equilibragens the rotary joint, and / or alignment of the various checks, where applicable.
These attempts usually have no effect, since the equilibrium condition or alignment are not the root of the problem. Depending on features such as the amplification factor and the damping system, the actions mentioned above can reduce the levels in the presence vibrométricos, but not enough that the machine can operate for long periods, without their reliability is affected. De facto, these actions are just trying to change the magnitude of the exciting force, not eliminating the resonance condition.
Conclusion resonance vibrations Analysis
For most builders / installers of equipment, the problems associated with resonance conditions are difficult to solve, due to the fact, sometimes, are not aware of the actual reason for the high levels vibrométricos presence in machine. Characterized this condition, sometimes, the resolution of the problem is relatively simple.
Case 4 – Analysis of vibrations in electric motors – Non-rotor split bars
Below you can see the evolution of the frequency spectrum between 1999 e 2001. Machine operators reported an abnormal noise.
In the successive spectra it was possible to observe:
- The growth of the component the speed of rotation;
- The growth of harmonics of electrical origin (nx50 Hz);
- The appearance of side bands 2 x the sliding frequency.
The growth of the rotational velocity component was due to beating with the sidebands at 2x the glide frequency..
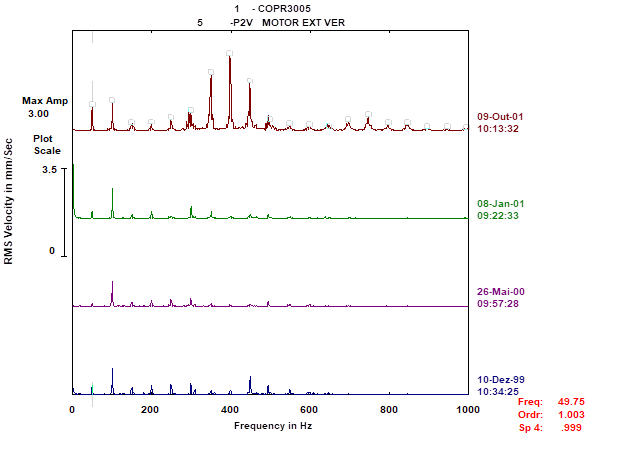
Figure 36 – Evolution of the frequency spectrum between 1999 e 2001
One could see amplitude oscillations of the harmonics of rotational speed and 50 Hz. Note that the two spectra were measured half an hour apart during engine warm-up.
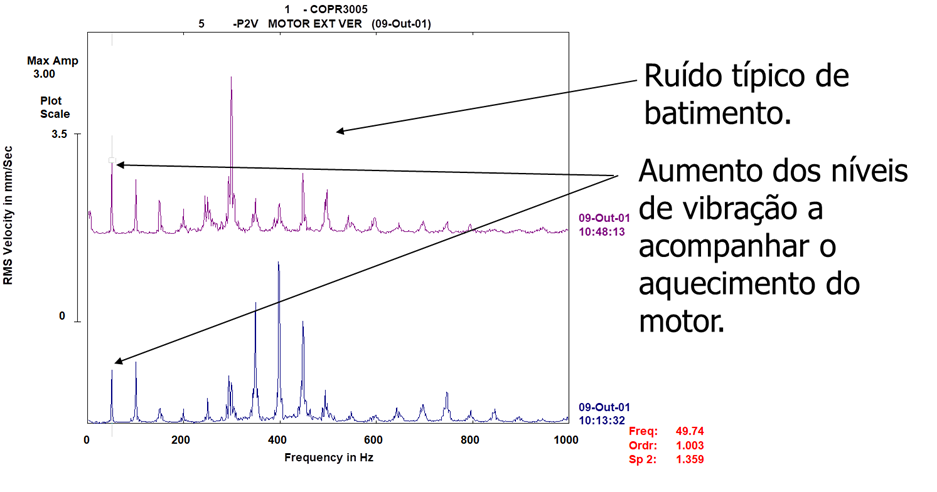
Figure 37 – Amplitude oscillations of rotational speed harmonics and 50 Hz
The knocking is caused by the proximity of the 2nd harmonic of the rotational speed with the 2nd harmonic of the mains frequency (100 Hz) and side bands
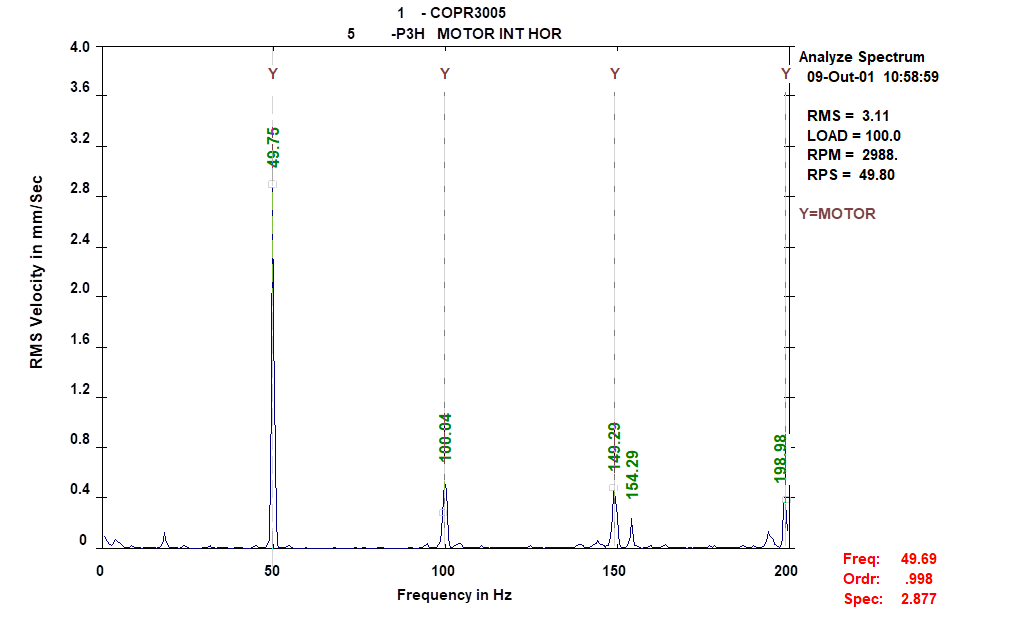
Figure 38 – spectrum up to 200 Hz
At the time of measurements, the slip frequency was 0.52Hz

In the high-resolution spectrum shown below, sidebands can be seen 2 x the sliding frequency (0,52 Hz) around 50 Hz.
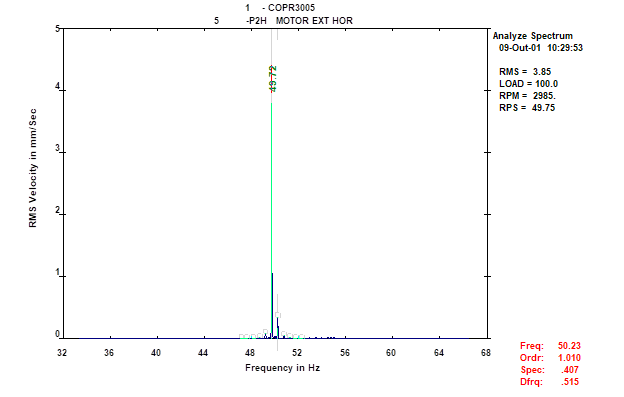
Figure 39 – Zoom to rotation speed.
The diagnosis issued was that there was a problem with broken bars in the rotor and the engine was sent for overhaul.