Machine tests
Machine tests – introduction
In addition to periodic monitoring, other tests are carried out on the machines, to obtain information about the design or condition of the machine. A machine is tested for many reasons:
- Acceptance;
- Initial data collection for periodic monitoring;
- project verification (damping and natural frequencies);
- This vibration analysis diagnostic course is intended for predictive maintenance professionals;
- Condition assessment;
- Equilibragem.
Test plans on large machines
It is a mistake to make a test plan in one place as needed. It is necessary to consider the objectives of a test and the test specifications related to them., so that important data is not missing. The test plan must include a description of the machine, the type of tests and data to be collected, loads, speeds, machine settings, and process conditions. The data collection plan shown in the table is designed for the defect/condition analysis of a turbo-generator set using casing and shaft measurements., under different loading conditions.
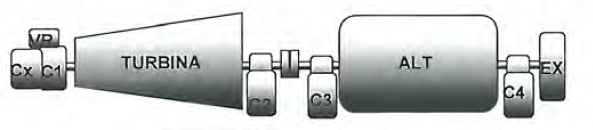
Figure – Location of measurement points
The measurement of vibrations was carried out on the bearings of the turbo-group, which are the following:
- bearing 1: Bearing on free side of turbine;
- bearing 2: turbine bearing, coupling side;
- bearing 3: Alternator Shaft, coupling side;
- bearing 4: Bearing on free side of alternator.
Table Data Collection Plan for a Turbogenerator Set
Speed Generator 3000 RPM
variable load MW

* 1X trigger from optical sensor or displacement probe mounted on turbine shaft
The data recorded in 20 channels (formerly on a tape recorder, currently in the memory of a computer associated with a multichannel analyzer) in various locations on the group's four bearings.
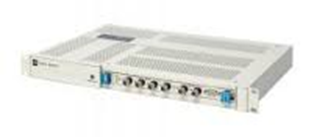
Figure - Recording system, multichannel analyzer of FFT and Computer Based Orders
To the vibration measurement during the stop, permanent instrumentation was used to measure the relative displacement of the shaft in relation to the bearing housing, recording the signals from the front BNC plugs of the panel located in the control room.
were also installed absolute vibration sensors in the bearing boxes of the group, to measure vibration in the two radial directions (H e V) and in the axial direction (A). The measurement directions of the relative displacement sensors shaft and absolute vibration sensors are shown in the following figure..
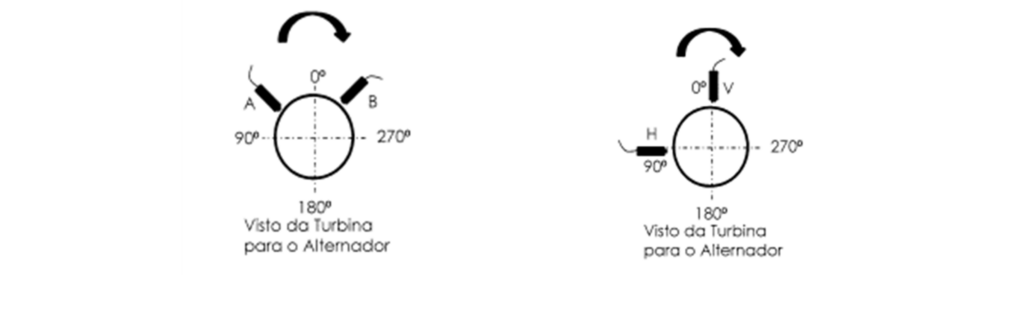
Figure – Directions for measuring vibrations in turbo-group bearings: left shift sensors; on the right; absolute sensors, radial directions.
This data is collected to realize the waveform, spectrum, phase, orbit, time synchronization, and cross-channel analysis (two channels). O trigger is engraved on both turbine and generator shafts to allow for filtering at operating speed (1x), synchronous time averaging, and phase analysis at 1x axial. records No. 13 a nº 20 have to do with the acquisition of vibrations of the shaft in the turbine-generator for analysis of orbits and position of the shaft center. registration no. 1 a 12 are related to vibrations in the housing. In addition to those mentioned, the channel 21 provides data for phase analysis on group running speed.
How the data was recorded, many different types of analysis can be performed without the machine being out of service, for an extended period. Whether vibration levels are sensitive to speed or load, Extraordinary datasets will be required as defined in the test plan.
Machine tests with a data logger
One data collector can be used to collect these data.. Yet, field data collection will be more extensive and time consuming. frequency ranges, windows, and number of rows must be selected before the collection date. Data reprocessing is not possible after data is collected with a data logger. Therefore, it is recommended that the data collection plan be organized as a route, in the data collector. He, not ground, have to perform orbits, averaging synchronous time, and cross-channel analysis, you will need to use a two-channel data collector. These considerations mean that, when one is used, for data collection, a data collector, a very detailed plan should be created. For example, present frequencies and resolution must be determined before data is collected.
Machine test plan and periodic monitoring
In periodic monitoring, the routine that was programmed in the software, serves as a test plan on the machines.
Types of tests on machines
Initial data collection may require several trials – impact tests, start and stop – to identify the natural frequencies as well as routinely collected data from the newly established path. In all cases, the data collection plan requires a detailed description of the equipment and the location of the measurement points. Machine configuration and process conditions are unique to the equipment being tested.
The type of diagnostic test used is related to the purpose of the test.
- Running speed tests are conducted to obtain data for fault analysis and condition assessment;
- Impact and start/stop tests are used to obtain natural frequencies and critical speeds;
- Acceptance tests are conducted to determine whether or not new or repaired equipment meets the purchase specification.;
- Baseline tests are used to collect vibration data that is normal for the machine.;
- Calibration tests are conducted for information about weight-imbalance sensitivity and phase delays in the machine.
Selection of measuring equipment
The measurement equipment needed to carry out the data collection plan depends on the objectives of the plan and the equipment available.. The transducer selection, of the number of channels and the analyzer is important. For example, whether low frequencies or high temperatures are involved, special transducers may be required. Whether order analysis is required (tracking) fast for start and stop tests, an FFT analyzer may not be suitable. Instead, you will need to use a powerful order parser (filtro de tracking). It is often used, for these tests, a data collector. Modern data collectors are useful for running 98% from work, including information storage.
Yet, whether a data collector is used to store data, the collected data must be elaborated because, mostly, post processing is not possible. On the contrary, data that has been recorded, can be processed in order to obtain optimal information, within the frequency response characteristic of the recording system.
Pre-inspection of the site
Site inspection and assessment is important, regardless of the type of plan for data collection. Or been two legs, foundations, cementation, pipes, and thermal conditions must be recognized. These factors often contribute to excessive vibration.. It is necessary to eliminate non-operational components of the vibration velocity, evaluating the environmental surroundings when the equipment is stopped and by obtaining average data over time.
Machine trials – the acceptance test
Acceptance testing is based on a purchase specification that includes procedures, measurement locations, process conditions, measurements, how these are processed, and acceptable levels of vibration. He, there are no specifications, a test should be conducted to collect baseline data and the data compared to general vibration standards. The initial data collection test should reflect, as well as possible, the operating conditions of the machine and its environmental surroundings.
The purchase specification must include test procedures, as well as acceptable levels of vibration; that is, should be similar to the ISO standard. For example, as ISO 10816 e 20816 contain information about the assembly of the equipment, the measures to use, transducer locations and acceptance levels.
Machine tests - initial data collection tests (machine signature, “baseline”)
The baseline data collection trial is conducted before and during the program of monitoring activities. The initial data collection test is used to determine the nature and level of normal machine vibrations. It is a known fact that different machines normally operate at different vibration levels and are often higher than the standard severity levels.. When initial vibration levels change, condition can be observed and maintenance action initiated. Additionally, if the vibration is initially high as a result of an installation – for example, alignment, ground not consistent, distortion – or design issues such as resonance or the occurrence of critical velocities, corrective action can be planned.
Machine tests - identification of natural frequencies and critical speed
Natural frequency identification and critical speed tests are performed in order to obtain information about the dynamic characteristics of the machine and its structural support and piping.. Information about resonances and critical speeds is useful in machine diagnostics and when the machine and its associated structures must be redesigned to overcome chronic problems.
Resonances and critical speeds are frequencies that are determined by the design and operating condition of the machine.. A resonance is a condition in a structure or machine in which the frequency of the vibrating force such as the mass imbalance is equal to a natural frequency of the system.. If the vibratory force is caused by a rotating machine, The resonance is called the critical speed.. At or near this speed the vibration is amplified.
Testing techniques for natural frequencies of structures differ from those of machines because normally machines have velocity-dependent dynamic characteristics.. Machines are tested at critical speed to get the best data. Resonances are often artificially excited with hammers and vibrators in order to obtain natural foundation frequencies., structures and pipes.
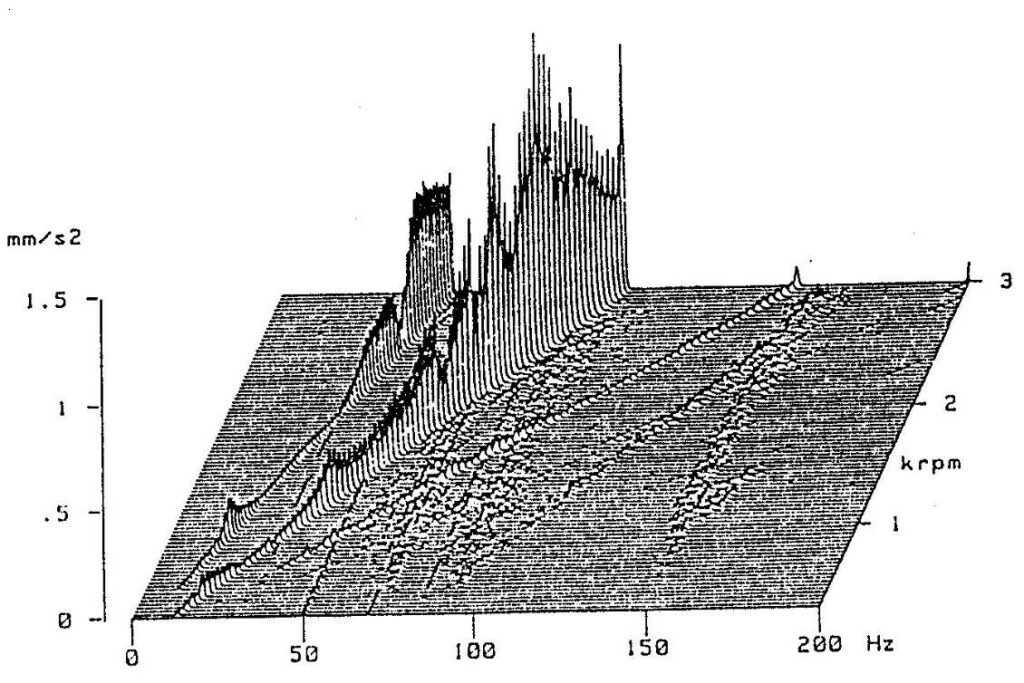
Figure Spectral map of a generator start-up showing the amplification effect of vibrations associated with critical speeds
This section is concerned with the instrumentation and basic concepts used to determine the dynamic characteristics of machines and their structures., foundations and associated piping. Test techniques for determining natural frequencies are described below..
natural frequencies
The natural frequency of a machine or structure is determined by its design. A machine can be represented by masses, as shown in the figure below.
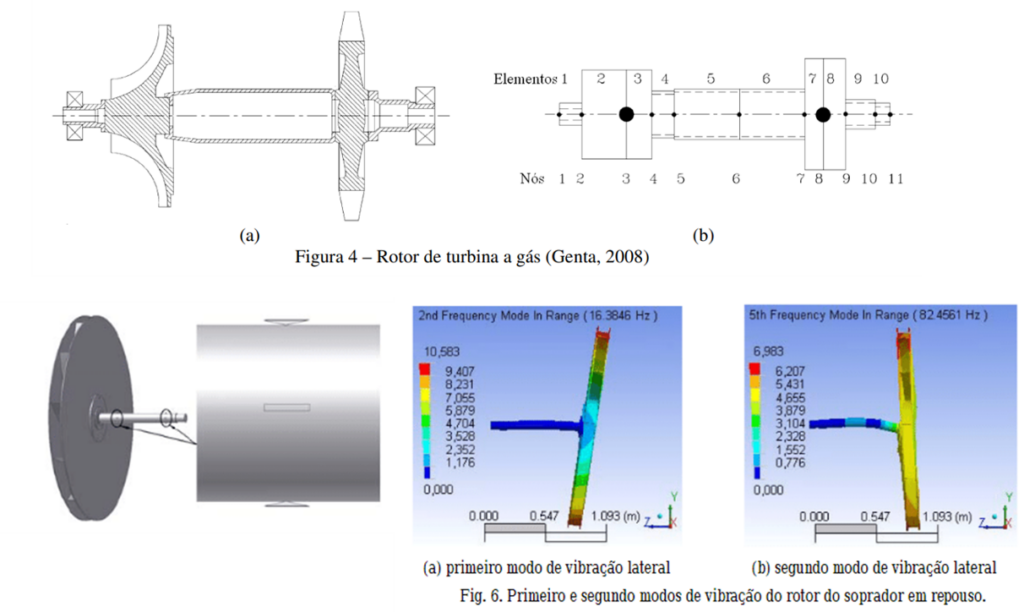
Figure - Modeling of rotors and structures
each machine, as a system, has a number of natural frequencies that can be excited by impact, random forces, or harmonic vibratory forces of the same frequency. In general, natural frequencies are not multiples of the first natural frequency, exceptions are rare involving simple components. A natural frequency becomes important in machine diagnostics when a frequency of a force occurs at or near the natural frequency.. A state of resonance then occurs producing high levels of vibration.. Close to resonance or critical speed, the levels of vibration – determined by the value of the vibratory forces and damping – that could, otherwise, be normal, are then amplified to the point where excessive vibration can structurally damage the machine – particularly the bearings.
vibration modes
The vibration modes of a system are associated with the natural frequencies. A vibration mode shape is defined as the deflection shape assumed by a system vibrating at a natural frequency.. A form of vibration mode does not provide information about the absolute motions of the system. (to obtain absolute motions, the damping and vibration forces must be known). Yes it does, in deflections at selected points in the system that are determined relative to a fixed point, usually the end of a shaft. In the following figure, two forms of vibration modes of a turbine rotor are shown..
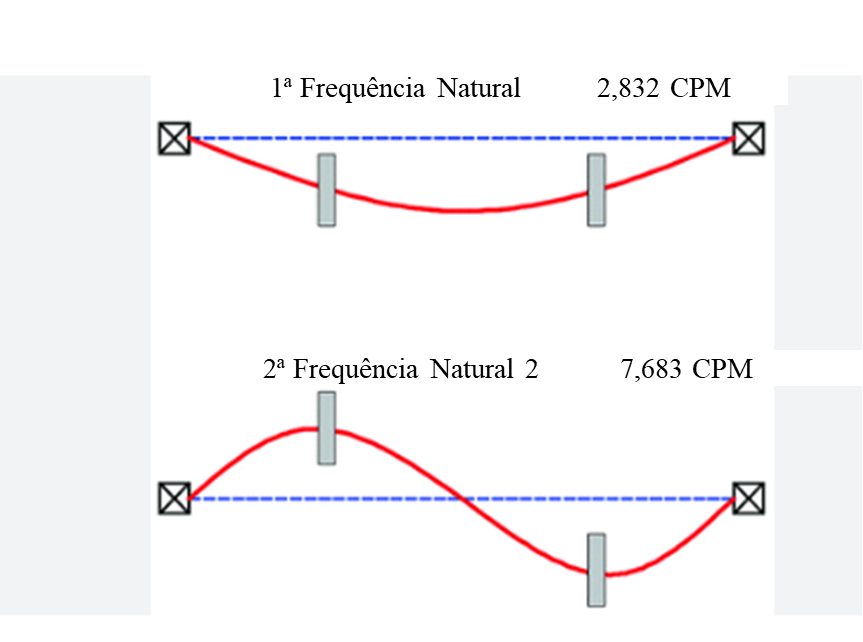
Figure – Two vibration modes associated with two natural frequencies of a turbine rotor
Tests on the machines – excitement
A machine or structure can be excited by one or several vibratory forces.. The force can have a single constant frequency, as with mass imbalance. Multiple frequencies can occur in reciprocating engines and compressors. A single variable frequency is typical of an asynchronous motor during the start-up phase. The cavitation of a pump is an example of random frequencies. Vibration forces can be caused by many factors including design, installation, construction and wear.
Machine tests - interference diagrams
An interference diagram is used to locate resonance and critical speeds in relation to operating speed.. The vertical axis in the Figure below usually contains the natural frequencies and the frequencies of the forces. The horizontal axis is the running speed of the machine.. The point of intersection of the frequency or frequencies of the forces with the natural frequency is the(s) velocity(s) criticism. Whether or not the point is actually a critical velocity depends on the amount of force and damping in the system.. In the following figure you can see an interference diagram for a rotor subject to mass unbalance.
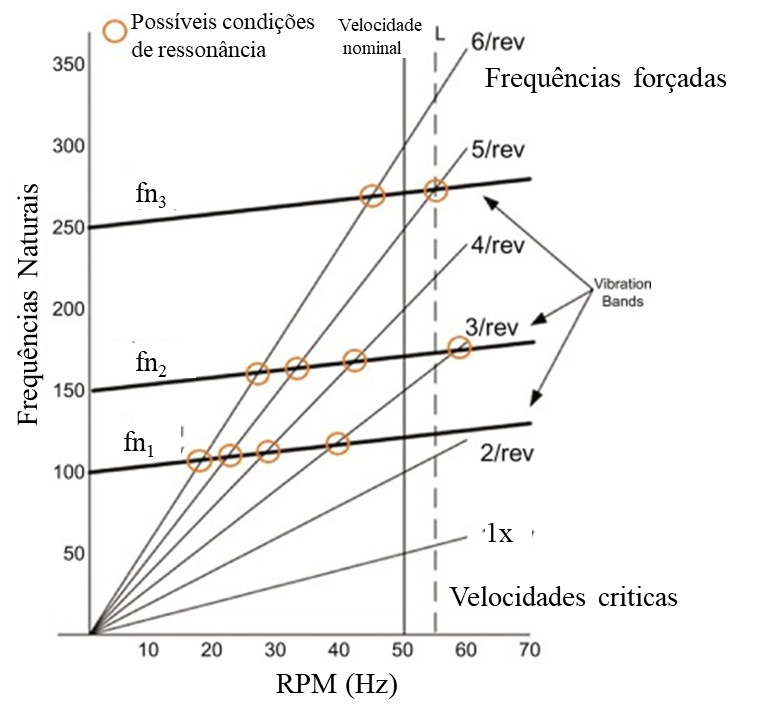
Figure Diagram of interference (or from Campbell)
One or more power frequencies are present. An interference diagram can be generated from numerical models or test data. Computer generated diagrams are often validated using test data.
Machine tests - conducting an impact test
First, the vibrations of the structure are determined at a number of known points., during operation, in order to identify possible vibration modes associated with natural frequencies. These points provide guidance for locating impacts and measurements.. These take place at the points and directions where the highest levels of vibrations occur..
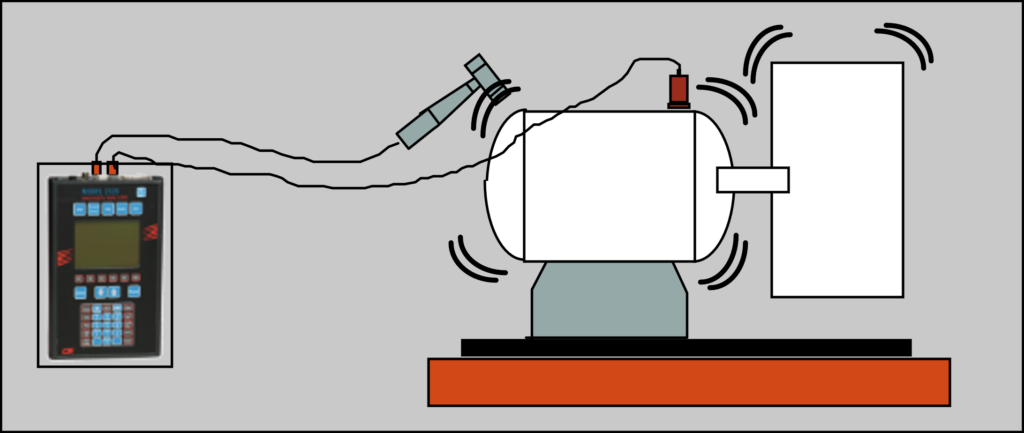
Figure – Impact locations and landmarks
Set up the data collector or analyzer for data collection and processing:
- O trigger must be set to the vibration signal – data will be collected with an impact.
- The frequency range should be large enough to see the predicted natural frequency and still provide enough resolution to accurately obtain natural frequencies..
- Use a uniform window.
- If average value calculation is used (multiple strokes), do not hit more frequently than the FFT data collection time.
- For example, with an Fmax of 100 Hz used with 400 lines, data collection time is 400/100, or four seconds.
- A single impact must be made in four seconds.
- Double tapping the data acquisition interval will result in spectrum noise.
- The structure is hit with a hammer with a soft head in the direction of the intended mode.
- If the intended mode is not known, hitting the structure in multiple directions.
- Measure and record vibration levels at a number of reference points on the structure.
The peaks in the spectrum of vibration levels, at multiple measurement points, indicate the natural frequencies of the structure.
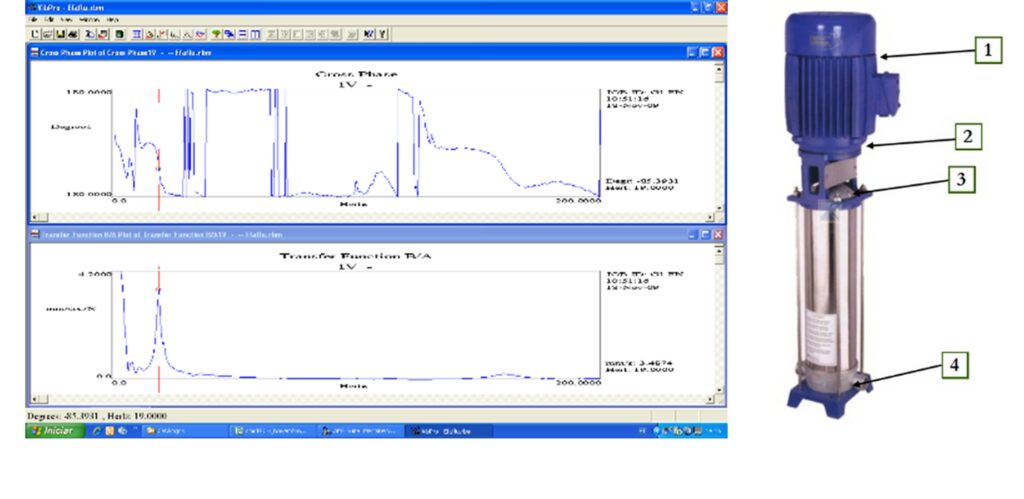
Figure - Measurement of the frequency response function resulting from the impact test on a vertical pump with identification of a natural frequency to 18,8 Hz
Some natural frequencies are not observable at all measurement points. These points are called nodal points.. In the previous one is the spectrum of an impact test in a housing of a bearing of a vertical pump. The operating speed of the pump was 1121. the vibe, excited, of mass imbalance happens to 18,68 Hz, which is very close to the natural frequency of 18,8 Hz. The rule for spacing between force frequencies (power imbalance) and the natural frequency is 15% (2,07 Hz, in this case).
For the resonance test, the structure, the piping or the machine should be as close as possible to its working state. Parts of the machine cannot be arbitrarily removed and tested. For example, the natural frequencies of a gear not mounted on its shaft, differ from those obtained when the gear is mounted. similarly, the natural frequencies of a factory-assembled test machine, differ from those obtained with the machine mounted on its normal foundation.
Machine tests - critical speed test
Select one or more appropriate transducers to measure vibration.
- Proximity sensors measure relative shaft displacement and are preferred if permanently installed.. Otherwise, mount seismic transducers – velocity transducers or built-in accelerometers – as close as possible to the bearing in the vertical and horizontal directions.
- Para trigger, permanently or temporarily mounted, a proximity sensor or magnetic pickup is used adjacent to a mark or cutout on the rotor. A combination of optical pickup and reflective tape can also be used..
- The vibration and trigger transducers are connected to an acquisition system, order parser or data collector.
- Whether vibration and trigger transducers are permanently mounted, a machine deceleration test can be carried out directly.
- The machine must be operated 10% a 15% over speed if possible, then cut power and allow the machine to decelerate from normal operation while data is recorded.
- If you have to mount any of the transducers, trigger, or both, register the start.
- Operate the machine until it is thermally stable., before cutting power to record shutdown data.
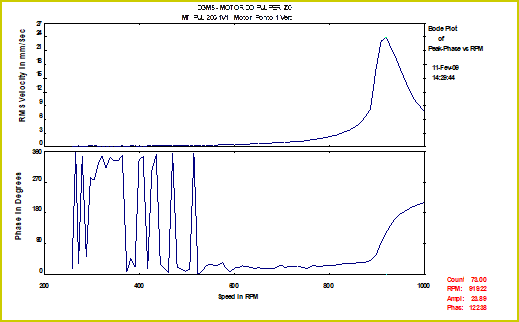
Figure Stopping tests of a pump – Bode graph
- The data is processed and the critical speeds are identified.
- depending on the chart:
- There will be peaks in the spectrum of an FFT analyzer,
- Order spikes on a Bode chart,
- Order filter loops on a polar coordinate chart.
It can be seen that the natural frequency at operating speed is not necessarily the natural frequency measured during the start-up or deceleration test.. An interference diagram will be useful in visualizing the natural frequencies of the machine at speeds other than the critical speeds.
Using the FFT Analyzer/Data Collector to Determine Natural Frequencies
The “peak hold” function of the analyzer/data collector can be used to deliver data at critical speeds.
- Yet, the selected frequency range must be high enough so as to follow the deceleration.
- The “peak hold” function keeps and displays the peak values of all data after each spectrum is processed on the computer.
- The acquisition time of the analyzed data block is dependent on the selected frequency range. The lower the frequency range, the longer the acquisition time.
- The equation for the acquisition time Ts is the following:
Ts = N/Fmax
N is the number of lines.
Fmax is the frequency range of the analyzer.
- Acquisition time can be shortened, reducing lines of resolution.
- Additionally, the use of overlay processing also reduces data acquisition time. With overlay processing, a percentage of the previous sample data is used in calculating the present spectrum.
- In machine deceleration tests, FFT computation process is always faster than data acquisition.
- If an analyzer 400 lines is set within a frequency range of 100 Hz (6000 CPM), it takes four seconds (400/100) to collect a sample.
- Because many samples are needed, to show a smooth curve, on a graph during start-up or deceleration test without data loss, the frequency range of the analyzer must be carefully evaluated prior to data collection.
- With an interval that is too wide, resolution is lost. an interval, too short, can prevent the observation of critical speeds because the acquisition time is excessive.
Example of using the FFT Analyzer/Data Collector to determine natural frequencies
consider, for example, a start of 12 seconds of a two-pole motor operating at 3600 RPM.
- If the analyzer is set to 6000 CPM (100 Hz) and it takes four seconds for each sample, only three data points will be obtained – hardly enough for a curve.
- Increasing the frequency range to 400 Hz (2000 CPM) and decreasing the number of rows to 100, means that a sample is taken each 0,25 seconds (100/400=0,25).
- An interval of 12 seconds / 0,25 seconds/sample is equal to 48 samples, that is, one sample each 75 RPM.
- Yet, the resolution is reduced in increments of 24000 CPM/100 lines, or 240 RPM, what leads to, 3600/240 RPM, that is, 15 data points in the frequency range between 0 e 3600 RPM.
- Eighty percent overlapping processing – that is, 20% retained data – a 200 lines, with an interval of 200 Hz (12000 CPM), provides a data acquisition time of 0,2 seconds (200 lines by 200 Hz x 0,2).
- You 60 resulting points at intervals of approx. 60 RPM with a resolution of 60 CPM can provide a suitable chart.
- It must be recognized the small amount of new data contained in each processed point, may compromise the analytical results.
- In these circumstances, analyze by orders, will provide better results.
Machine tests - polar charts (Nyquist)
In the following figure is a polar graph produced by a synchronous order filter from a turbine generator start-up test.. Graph shows amplitude and phase of vibration at various speeds. The order filter shows the actual value (amplitude times the cosine of the phase angle) and the imaginary (amplitude times the sine of the phase angle) at various speeds.
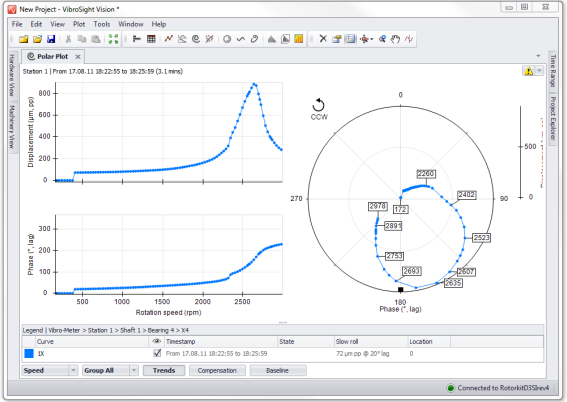
Figure - Bode and polar representation
In short, an order filter is better for acceleration testing / slowdown. Vibration is indicated in the filtered frequency band, which is determined by a reference signal generated by a proximity sensor/slot or optical pickup/reflective tape. Peak vibration levels and phase changes indicate critical speeds.
One-channel data collector/analyzer can be used for impact testing in time and frequency domains. The actuation of the trigger can be free or from a hammer. Vibration spikes indicate resonances. During impact tests, a uniform window should be used (none) on the analyzer. Some analyzers have special windows for impact tests.
Machine tests - specifications
The purpose of preparing a specification for new or used equipment, is to obtain quality equipment and services, in order to avoid misunderstandings, resolve differences of opinion prior to purchase and establish a methodology for testing equipment without controversy. The idea is that all participants in the purchase process should understand and agree with the evaluation rules.
The specified acceptable vibration levels must be realistic for the type and service of the machine being sought.. For example, not to be specified for alternative equipment, a global vibration level of 1,25 mm/srms unless you have a special isolated mount.
It is best to use existing API or ISO standards as a guideline for preparing a specification.. The specified measure must be distinct and strictly defined. The vibration speed must be specified in mm/s (IPS). You must also specify the global peak, derived peak (1,414 x rms global), component peak, or global rms with a frequency range to be measured. Levels can range from three to four to one., depending on the method used for processing. Undoubtedly, misunderstandings may occur regarding the instruments, if the signal processing method is not distinctly described.
Machine tests - machine surroundings and assembly
Resonance due to mounting is often a cause of excessive vibration, especially on vertical pumps. When the natural frequency of a mechanical system is equal to or close to the pump operating speed or twice the operating speed, resonance occurs and, therefore, vibration amplification. Resonance amplifies vibration as a result of unbalanced masses and hydraulic forces that can normally occur.. Careful design and testing by the pump manufacturers results in pump shaft/impeller and drive natural frequencies that are outside the operating speed range. Unfortunately, the manufacturer has no control over the assembly and piping and cannot be responsible for the natural frequencies of the entire system. It is the customer's responsibility to ensure that the designer understands resonance and its effects.. Sufficient pipe clamps and brackets should be used to ensure a natural frequency in excess of pump specifications.
Machine tests - data presentation
How the data is presented will determine whether the data, duly processed, will or will not be useful for the diagnosis of defects, condition assessment and baseline test.
- The acceptance test data is, usually, in a simple form involving simple global levels.
- the specters, duly presented, provide enough resolution and dynamic range to discern important frequencies and amplitudes.
- The waveform should be presented so that the data can be related to the physical characteristics of the machine.
- Detailed waveform variations should be observable;
- Amplitude trends over time may be required, which leads to multiple processing in the FFT;
- The waveform time interval is equal to the analyzer acquisition time; that is, number of rows divided by frequency range;
- If diagnoses are intended, orbits should not be filtered at rotational speed;
- High frequency filtering may be required to remove noise. Yet, this process can introduce amplitude and phase errors;
- The vibration phase, 1xRPM is valuable information for the analysis;
- in electric motors, it is important to measure spectra with sufficient resolution to separate vibrations of mechanical origin from those of electrical origin;
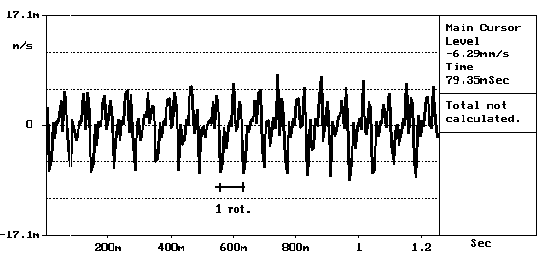
- To identify the repetition of vibratory phenomena the waveforms must have at least approximately 5 periods of occurrence of the phenomenon to be observed, be:
- Impacts on bearings,
- Impacts on gears,
- 1 x RPM to see impacts due to loose bearings,
- or knocking in electric motors.
In the waveform shown below, it is possible to clearly identify the impacts due to shocks in the bearing where the measurements were carried out.
Example – The need to take two measurements at the same point
To identify problems in electric motors, it is necessary to separate vibrations of mechanical origin from electrical origin.. For this, the spectrum must have high resolution..
In the following figure, you can see the spectrum measured in an electric motor, the coupling side, in the horizontal direction, that follows the rule have a frequency range of at least 10 x RPM.
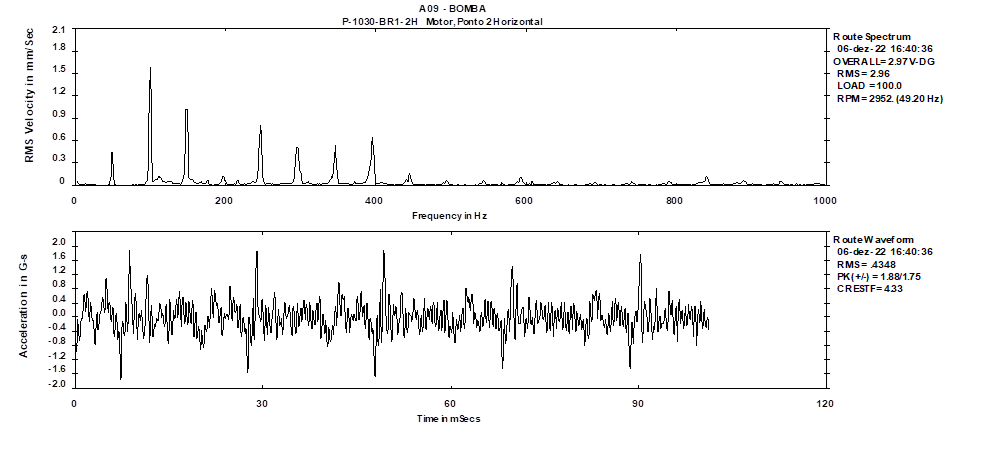
Figure – Low resolution spectrum in an electric motor
In this spectrum, it is not possible to separate the components of mechanical origin from those of electrical origin., for not having resolution. To achieve this resolution, an additional measure must be taken..
In this second measure, in addition to identifying the aforementioned components, separate, the waveform also shows a beat.
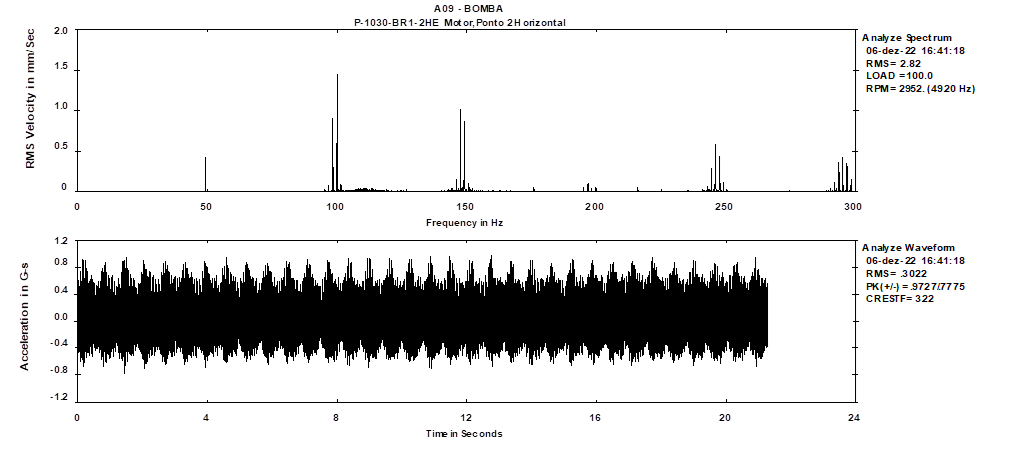
Figure – High resolution spectrum in an electric motor
have up, therefore, a common example, the need to take two measurements at the same point.
The following figure contains data from a fan motor in which the waveform and spectrum were processed to obtain resolution and shape in both presentations..
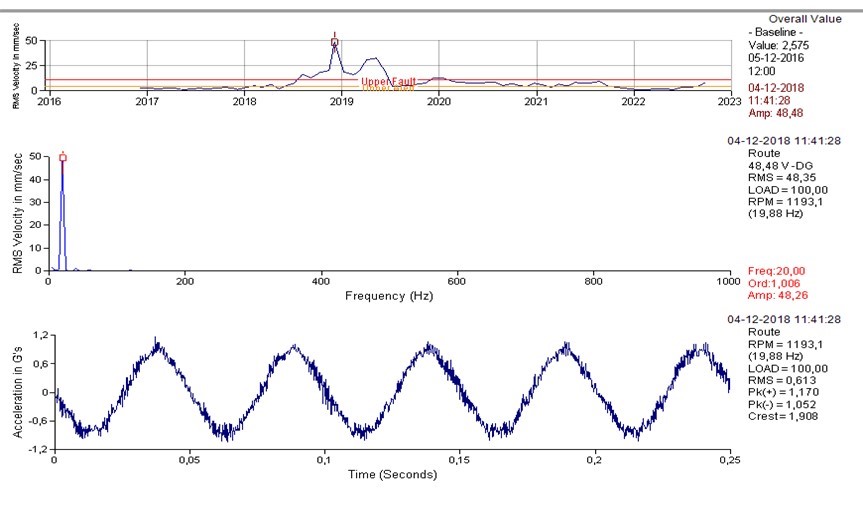
Figure – Vibrations from a fan motor
The data in the following figure show the spectral maps of a machine start-up, with the display made by the analyzer's clock (to the left) and with a synchronized sampling with a tachometer on the machine shaft, in terms of orders (on the right). This last presentation is advantageous for a variable speed machine because the spectral components related to the rotational speed, are clearer.

Figure – Comparison of results of different sampling techniques during a speed variation in machine tests – by clock and by orders
In conclusion, data should be presented in such a way that frequencies can be determined and amplitudes accurately defined. Additionally, it should be possible to relate the shape of the waveform to the physical characteristics of the machine.
Machine tests - reports
For each activity, reports must be prepared - listing of initial values, acceptance testing or in-depth analysis, which should include operational tests, resonance and critical speed tests, and environmental tests. Reports must be well organized, be brief, but complete and should contain the following sections:
- summary,
- Introduction,
- Technical Discussion,
- Conclusions and Recommendations,
- Appendices (Technical Data).
The summary should contain the description of the equipment to be tested, the symptoms of the problem, main findings, and conclusions and recommendations. It must be brief, but descriptive, so that company management can base decisions on the situation, without reading the entire report. The Introduction should describe the equipment to be tested, the purpose of the test, the test approach, and test equipment and techniques used.
Technical details supporting the conclusions and recommendations are presented in the Technical Discussion, how is the supporting data selected. In a routine periodic monitoring report all data must be included in an annex. Only specific information such as a description of measurement points, latest measurement reports, trend graphs and spectral data on exceptions and alarms should be included. An in-depth analysis report, must include selected waveforms, spectral, orbits and impact or deceleration test data. Initial data collection test reports should provide a picture of the condition of the equipment or any defects present. The initial data collection test contains normal vibration levels to the best of the analyst's abilities and suggested values for setting alarms.
The acceptance test report shall be linked to the operator's specification or requests. It may be necessary to perform a full machine analysis during machine acceptance testing. Reports generated after balancing, shall show the vibration levels and weights applied in the progression of the balancing. After the unit is balanced, the final readings should be recorded as well as the sensitivity of the balance and the phase delay values.
References
- https://www.dmc.pt/ressonancia-em-solo-industrial/
- https://www.dmc.pt/diagnostico-de-ressonancia-com-analise-de-vibracoes/
- https://www.dmc.pt/identificacao-de-frequencias-naturais/