Identification of natural frequencies
1 – Introduction – Identification of natural frequencies with a vibration analyzer
In this article on identifying natural frequencies with a vibration analyzer, Several methods are described for determining natural frequencies in a machine or structure..
Whenever one suspects the possibility of resonance phenomena occurring, or if you want to confirm the frequencies calculated by analytical methods, It is important to experimentally determine the natural frequencies.
2 – Types of tests and machine condition / structure during its realization
The tests can be carried out with the machine under the following conditions:
- stopped machine
- the impact test
- Measuring the frequency response (FRF)
- Machine in speed variation;
- The average peak retention (Peakhold)
- As ordens
- To cascade
- O bode e o Nyquist
- Machine running in steady state;
- Negative mean
2.1 Identification of natural frequencies with a vibration analyzer – Tests with the machine stopped
This type of tests is based on the principle that any structure, when free, vibrates at its natural frequencies. Therefore, to observe its natural frequencies, it is enough, for example, make an impact on the structure and observe the response.
There are two ways to look at the impact.
The simplest way is to measure only the response; the so-called impact test.
The most elaborate way is to measure the Frequency Response Function (FRF). This is obtained using a hammer instrumented with a force transducer in order to know the energy that is being introduced into the structure.. This way of measuring the natural frequencies is more accurate and allows the comparison of the measured results with finite element models and modal analysis..
Below you can see the units in which the FRF can be formulated.
| Dynamic stiffness | Strength / displacement |
| receptivity | displacement / Strength |
| Impedance | Strength / velocity |
| Mobility | velocity / Strength |
| Dynamic inertia | Strength / Acceleration |
| Acceleration | Acceleration / Strength |
Measuring the frequency response (FRF) in addition to one of the functions described above, provides information about the phase of the vibrations and the coherence function.
In a measurement of the Frequency Response Function the following can be observed:
- resonances – The peaks indicate the presence of the natural frequencies of the structure under test;
- Damping – Damping is proportional to the width of the peaks.. The wider the peak, the greater the damping;
- vibration mode – The amplitude and phase of multiple acquired FRFs relative to a common frame reference are used to determine the mode shape..
Coherence is function versus frequency, which indicates how much of the output is due to the input in the FRF. May be an indicator of FRF quality. Evaluates the consistency of the FRF from measurement to repeating the same measurement. The value of a coherence function varies between 0 e 1.
in a vibration analyzer as part of a program of, unequivocally defines that we are in the presence of a natural frequency because, in resonance the phase varies 180º. If this variation is less than 180º, it means that, or the structure is heavily cushioned or else, that the movement of the structure in the resonance does not occur in the direction of the accelerometer and / or the hammer.
2.2 Identification of natural frequencies with a vibration analyzer– Tests carried out with the machine at speed variation
In the tests carried out with the machine in speed variation, the forces generated in the operation of the machine are used to excite its natural frequencies.
This test can be performed at start-up or stop.. If the machine starts too quickly, it is more convenient to do it at a stop.
2.2.1 The average peak retention (Peakhold)
The average peak retention (Peakhold) is the simplest way to identify natural frequencies when a machine is stopped. Works great when the frequency spectrum only has rotational speed.
Peak retention averaging is technically not an averaging process. The peak detection algorithm retains the highest recorded spectral value during the averaging time (effectively the worst of the results). Each time the waveform data is transformed to the spectral domain, each line of amplitude data is compared with the previous one and the largest amplitude is kept. This process is repeated until the analyst stops collecting data., or until the number of programmed averages is fulfilled. Noise and all other background signals are all kept at peak values.
2.2.2 The analysis by orders
When analyzing rotating machines, measured data will depend on rotation speed. Varying rotation speeds will change the characteristics of the measured data.
Components of the measured signal that change frequency with changes in speed are referred to as rotational speed harmonics or orders.
The 1st harmonic component has a frequency equal to the rotational speed, indicated in Hz, and for example, the 10th harmonic has a frequency 10 times greater than the 1st harmonic. Velocity variations cause the relevant harmonic frequency components to change up and down in frequency..
If a measured system were running at a perfectly constant rotational speed, then the harmonic orders in the FFT spectra would remain on the same spectral lines throughout the measurement. Actually, the machines will have some speed variations, even though they are set to run at a certain rpm value.
When using order analysis instead of FFT analysis, spectra will relate to vibrations per revolution rather than vibrations per second. Therefore, will be independent of the speed of rotation. This provides stable harmonic order patterns across varying speeds for rotation-related vibration components..
Another advantage of using order analysis for rotation-related measurements is to avoid widening the order-related spectrum components.. Stretching happens when the frequency pattern changes during the calculation of a spectrum. This can be either during the calculation of an instantaneous spectrum or across multiple instantaneous spectra that are measured together..
Broadened spectra will lack clear harmonic peaks, since the peak frequencies were changing during such spectrum calculations. Instead of clear harmonic peaks, the stretched spectra will spread the energy of the harmonic orders over the frequency ranges related to all the rotational speeds present during the spectrum calculation.
When using order analysis, spectral smearing is avoided for such non-stationary signals, since the harmonic components of rotation remain at fixed order positions in the order spectra.
In order to carry out the analysis by orders, information about the rotation speed of the machine is required., usually measured with a tachometer.
2.2.3 Identification of natural frequencies with a vibration analyzer– The Cascade of Wraiths
In the cascade of spectra these are presented over time or another parameter.
2.2.4 Identification of natural frequencies with a vibration analyzer – O Bode
The Bode plot is merely vibration amplitude and phase versus shaft speed.. However, can potentially provide a lot of information not available from steady-state measurements like the FFT. The most common use of the Bode is to identify the natural frequencies present in the machines.. The most common are the calls “critical speeds” that occur when the rotational speed of the shaft coincides with a natural frequency and produces a resonance. This appears as an amplitude peak and phase shift on the Bode plot.. Identification of natural frequencies is especially critical in turbomachinery because, unlike most general purpose equipment, work above or near a, if not more, natural frequencies or modes. The Bode plot is more powerful in identifying synchronous vibrations. While the overall vibration can also be plotted against the shaft speed, the Bode plot is not really a tool to identify non-synchronous vibrations.
2.2.5 Identification of natural frequencies with a vibration analyzer – why is it important when looking at speed variation in a machine (Nyquist)
The Polar chart displays exactly the same data as the Bode chart, just in a different display format. in the polar portion, the magnitude of the displacement vector is measured radially, from the center of the graph and the phase is plotted circumferentially. A resonance is indicated on a graph by the speed at which the amplitude is the maximum of a loop (that is, approximately 180 degrees of phase change).
2.3 Tests carried out with the machine running - the negative average
Negative mean is an impact test method, with the machine running.
If we make impacts on the machine, when not working, we get only the natural frequencies. But if the machine is working, then we also get the spectrum with its speed of rotation and harmonics and other frequencies. These two spectra are what we can see on the screen.
Negative averaging procedure eliminates operating frequencies. Thus, only the natural frequencies remain in the spectrum.
To perform a negative average, when measurement starts, first of all, the reference spectrum is taken, with the machine running. This means that this spectrum contains only the operating frequencies.
Then repeatedly impacts are made on the machine. From each measured spectrum the analyzer extracts the reference spectrum with the operating frequencies, that was measured at the beginning. The average is performed from these subtracted spectra.
How we measure vibrations generated by impacts, For best results, use the exponential window., also using, o trigger de amplitude.
3 Identification of natural frequencies with a vibration analyzer – Application example
3.1 Identification of natural frequencies with a vibration analyzer – The purpose of the essay
For this example we will use a didactic model that is a grinder. The purpose of the test is to measure the natural frequencies of the grinder, supported by its rubber supports, in different ways.
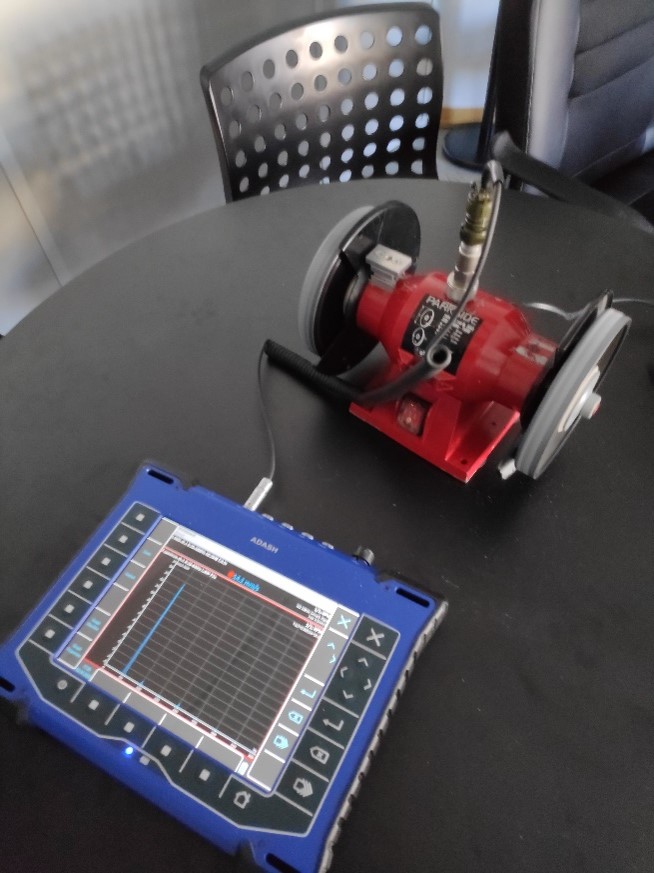
As measuring equipment we will use a vibration analyzer multichannel ADASH VA5Pro with accelerometers and a tachometer.
3.2 Identification of natural frequencies with a vibration analyzer – The measurement and excitation points
to each natural frequency a vibration mode is associated.
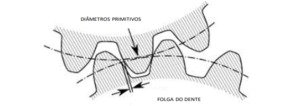
The vibration modes we expect to see in the base of the model on its supports, are translation and oscillation, as you can see below.
The measurement and excitation points are chosen depending on the way you want to see.
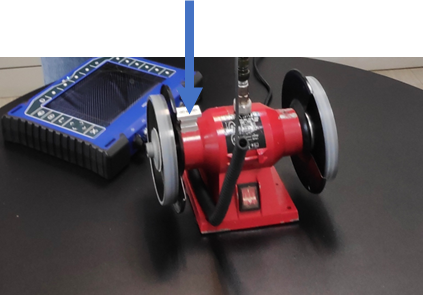
Thus, the translation vibration mode can be excited by an impact in the middle of the model or by a force imbalance as seen in the figure.. The oscillation mode can be excited by an impact on one of the extremes of the model or by a torque imbalance.
| Excitation point to identify translational vibration mode | Excitation point to identify oscillation vibration mode |
 |  |
3.3 Identification of natural frequencies with a vibration analyzer – Tests with the machine stopped
3.3.1 Impact test
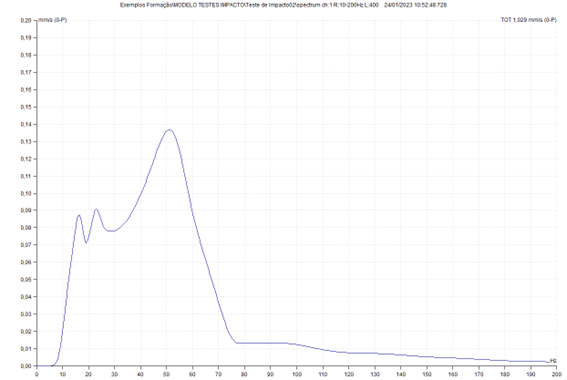
a) Excitation point of force and accelerometer response measurement in the center of the model
The results of this assay can be seen in the ADASH DDS program. The highest peak corresponds to the natural frequency of translation in the vertical direction..
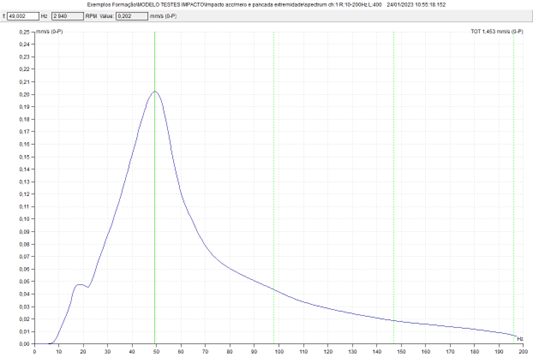
b) Force excitation point and response measurement accelerometer at model tip
In the video below you can see the practical implementation of this test.
The results of this assay can be seen in the ADASH DDS program.
In addition to the highest peak corresponding to the natural frequency of translation in the vertical direction, can be seen, at lower frequencies the natural frequencies of the oscillation modes.
Comparing this measure with the previous one, one can see the importance of the point of excitation and measurement, for the identification of the different natural frequencies.
When the excitation is carried out in one of the nodes (point with no movement) in a vibrating way, this is not excited.
3.3.2 Frequency Response Function (FRF)
In the video below you can see the practical implementation of this test.
The results of this assay can be seen in the ADASH DDS program.
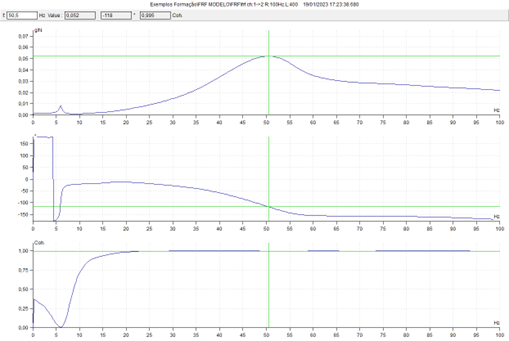
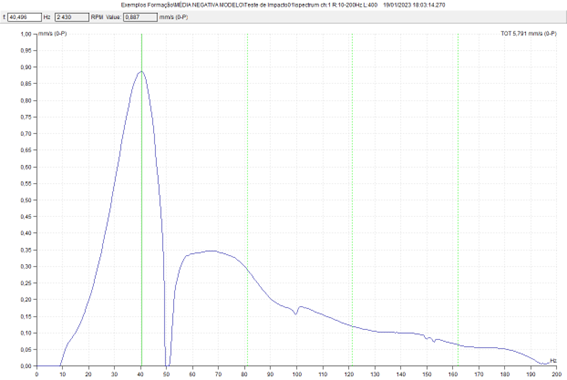
Again appreciate the natural frequency in the vertical direction in the zone of the 50 KHz, as in previous tests. It can be seen that it consists of a very wide peak. This is because there is a lot of damping due to the model's rubber pads.. Coherence in the zone of this natural frequency has a value close to 1 (0,995) indicating that it is well esteemed. The phase variation at this frequency is also clearly seen..
It can be seen that the peak at about 6 Hz, has a very low coherence value and, therefore, must be discarded; it is not a natural frequency.
3.4. Identification of natural frequencies with a vibration analyzer – Tests carried out with the machine at speed variation
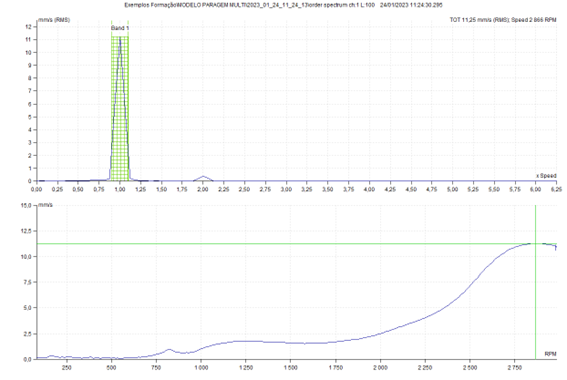
3.4.1 The average peak retention (Peakhold)
In the following video, you can see the practical implementation of this test with the model with a moment imbalance that will excite the natural frequencies of translation and oscillation.
The results of this assay can be seen in the ADASH DDS program.
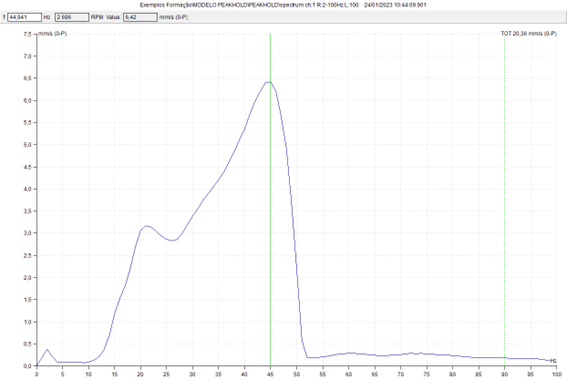
In addition to the highest peak corresponding to the natural frequency of translation in the vertical direction, can be seen, at lower frequencies, the natural frequencies of the oscillation modes.
3.4.2 Analysis by orders and cascade
In the following video you can see the practical implementation of this test with the model with a force imbalance that will excite the natural frequency of translation. Note the tachometer to allow analysis by orders.
We use the functionality of the VA5PRO, that allows us to carry out these measures (and a few more…) in parallel and, thus, we have the simplified comparison of results.
In order analysis, regardless of model rotation speed, the component at 1xRPM is always displayed at the same position in the spectrum. Note that the 1xRPM component is narrower in the order spectrum than in the fixed frequency spectrum.
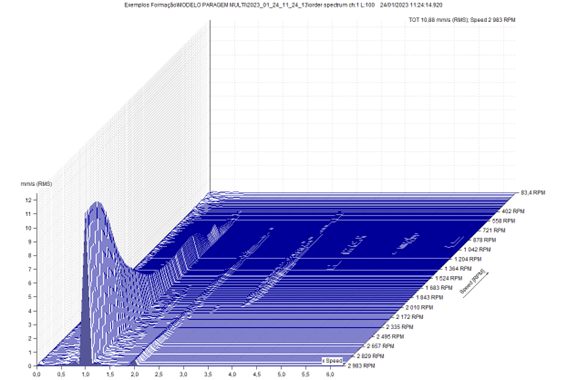
Note the measured rotational speed, in the acquisition of the successive spectra, bottom right side. The component at 1x RPM always appears at the same position in the spectrum.
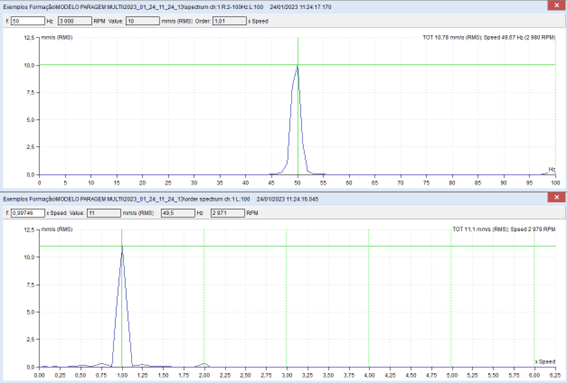
The following graph was obtained from a cut in the previous graph at 1x RPM. Note the natural frequency at 48 Hz.
Then there is a cascade, for which the tachometer is not required.
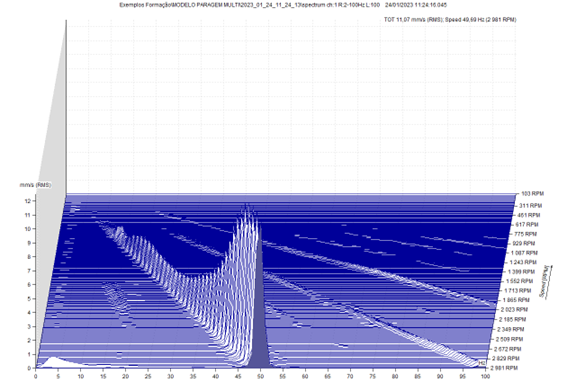
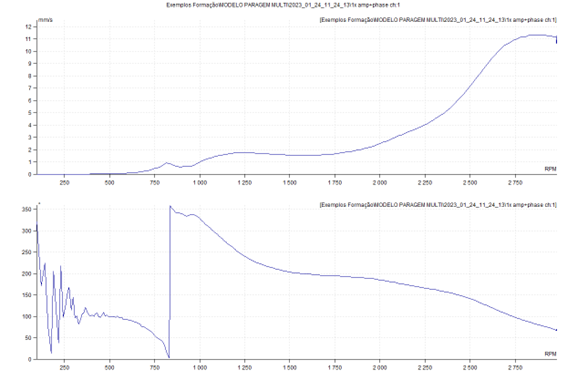
In these two spectrums, presented below, the top one obtained at fixed frequency, and the one below in orders, it can be seen that in the upper spectrum, the component to the rotation frequency, obtained the 2952 RPM, is "lengthened", due to the variation of speed of the model, during measurement, relative to the spectrum below.
again you can see, well marked, the natural frequency associated with the mode of translational vibration in the vertical direction, a 48 Hz, with a lot of cushioning.
3.4.3 O Bode e o Nyquist (or polar)
Using the functionality of the VA5PRO, that allows us to carry out these measures (and a few more…) in parallel, we will use the data from the last test to visualize them in the ADAH DDS program.
Below you can see a Bode chart obtained from the analysis by orders, during the previous model stop. Again, as expected, can be seen, well marked, the natural frequency associated with the mode of translational vibration in the vertical direction, a 48 Hz, with a lot of cushioning.
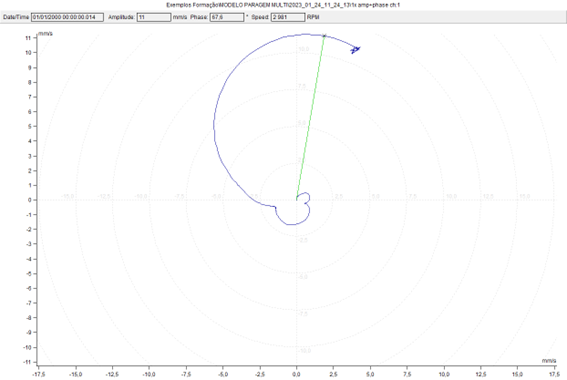
Below you can see the Nyquist plot (or polar) of the same data. In this graph the phase variation of 180 it's more obvious. Resonance occurs when the vector is maximum.
3.5. Identification of natural frequencies with a vibration analyzer – Tests carried out with the machine running - the negative average
In the video below you can see the practical implementation of this test.
The results of this assay can be seen in the ADASH DDS program.
4 Identification of natural frequencies with a vibration analyzer – Conclusion
Here we review several techniques that can be used to experimentally identify natural frequencies..