Wireless vibration measurement – practical case 1
Wireless vibration measurement - practical case 1
The systems of wireless vibration measurement present opportunities to collect in an easier way, Useful information, for maintenance managers. Like this, this article presents a practical case.
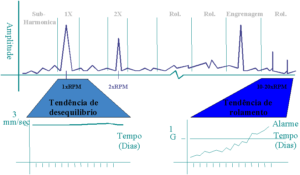
The need for up-to-date information to decide whether to stop the machine ...
It is known that it is part of the daily routine of maintenance managers, experiencing symptoms of abnormal behavior on equipment, be subject to the following dilemma:
- Decide whether to stop the machine, for an intervention, with a strong negative impact on production and running the risk of finding nothing;
- They do not stop the machine and risk that it has a serious malfunction and has to be subjected to a prolonged and expensive maintenance intervention..
In these circumstances, what was needed was to have a permanent vibration monitoring system that, immediately, real-time information, minute by minute, about the operating condition of the machine. In fact, it was convenient to have a system that would allow to know if the condition of the machine was stable and if it could work for some time., in this conditions. Or if on the contrary, due to his condition getting worse, it was necessary to stop the equipment immediately so as not to face, inevitably, a catastrophic breakdown.
Effectively what happened in the past was that, or the permanent monitoring system was already there, or it would take a few months for a new system to work.
On the contrary, now with wireless monitoring systems, a system like the one described from one moment to the next can be put into operation.
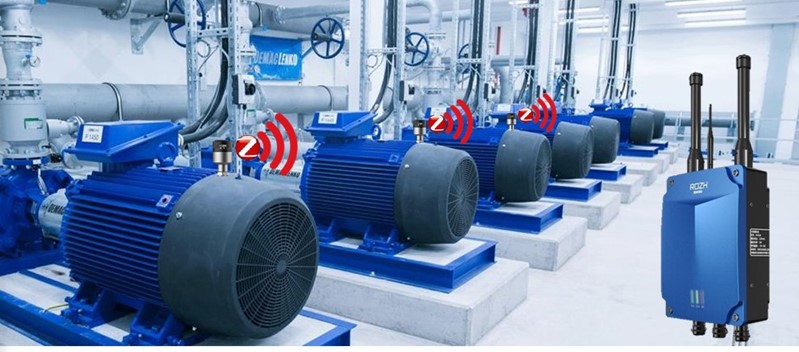
Wireless vibration measurement - ease of assembly
De facto, there is nothing simpler to assemble than a wireless vibration measurement system. So see:
| 1) The data collector is placed where there is 3G coverage (or wireless network or Ethernet -TCPIP) and connects to 220V power; | 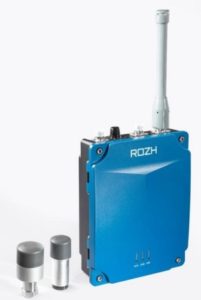 |
| 2) The sensors are placed at the measurement points and the power is connected to batteries; | 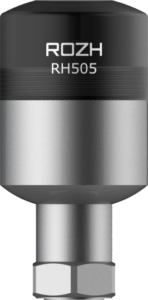 |
| 3) In the browser, the results of measurements on the remote server are observed, you don't need to be in the facilities where the equipment is. | 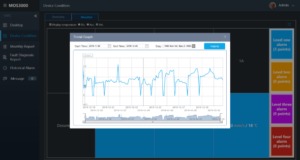 |
Like this, all together wasted an hour. Where more time was spent and what was behind and was not included, was in the computer configuration of the system. However, this is not the work of predictive maintenance technicians and maintenance managers who do not have to worry about this..
Practical example 1 - wireless vibration measurement application
The situation of the equipment manager
A generator set with several tens of megawatts began to stop unexpectedly, without apparent cause, triggered by your protective vibration monitor. This firing always occurred in the same bearing as the turbine, and by the same sensor. This system, being exclusively protective, its exclusive function is to protect the machine in case of excessive vibrations. De facto, does not collect information about the measures being carried out and, therefore, has no predictive functions. This way, it does not provide information to support decision making about maintenance interventions on the machine.
Hence the classic question:
- Decide whether to stop the machine for an intervention with a strong negative impact on production and at the risk of not finding anything;
- Do not stop the machine and risk that it has a serious malfunction and has to be subjected to a prolonged and expensive maintenance intervention..
To answer this question, DMC was asked to set up a wireless vibration monitoring system whose objective was to find out if there was a real rise in vibration levels before the protective system gave the order to stop the machine.
The DMC solution to collect additional information to address the problem
The assembled system is what can be seen in the diagram below.
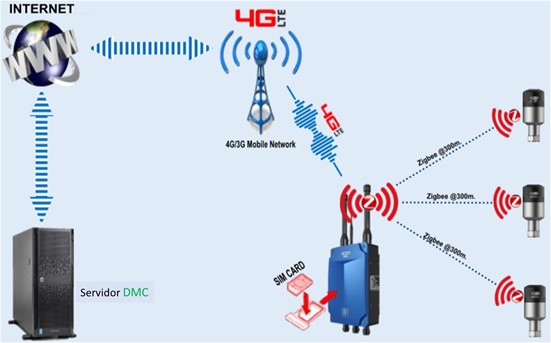
The computer configurations were previously made at the DMC facilities so that the commissioning on site was very fast.
Parameterization of wireless vibration measurement
The system was customized to perform the following measurements:
- Acceleration – waveform and spectrum - each 2 minutes
- Acceleration - overall value - each 30 seconds
- Speed - spectrum (2-1000 Hz) and overall value - each 2 minutes
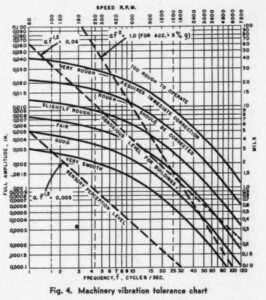
Wireless vibration measurement results
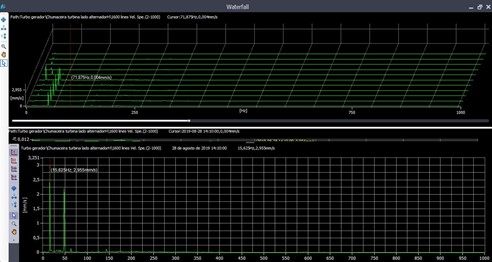
Below you can see the graph corresponding to the wireless vibration measurement measurements made between 23 of a month and the day 17 of the following.
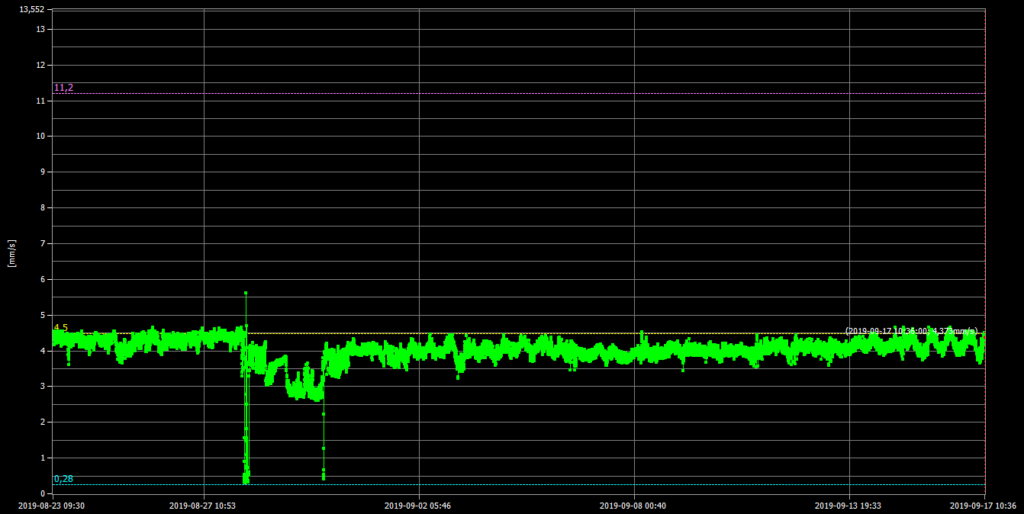
As shown in the chart, this period occurred machine stops, no day 28 e 30 of August, triggered by the monitor protective vibrations, that excessive vibrations measured.
The following can-vibration graph details, at one of the stops where you can see three stops with clear vibration levels rising in the last two.
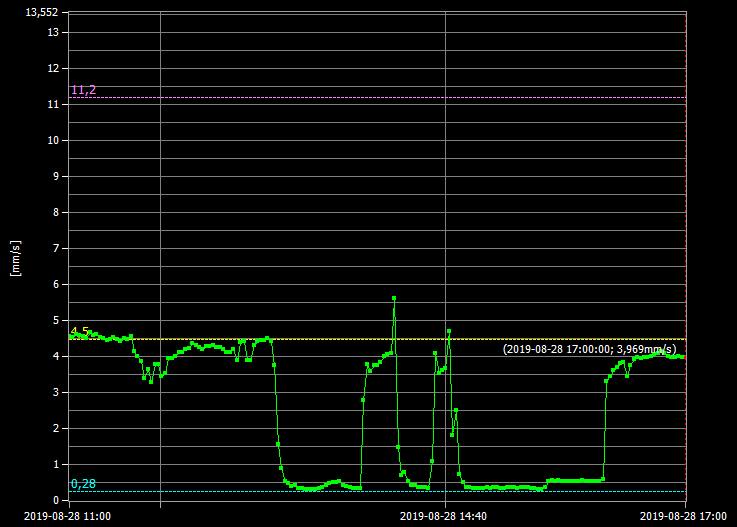
In this graph of two measurements in two minutes, you can see that one of the days, occurred three stops. In this graph, the latter two show vibration level rises before stopping.
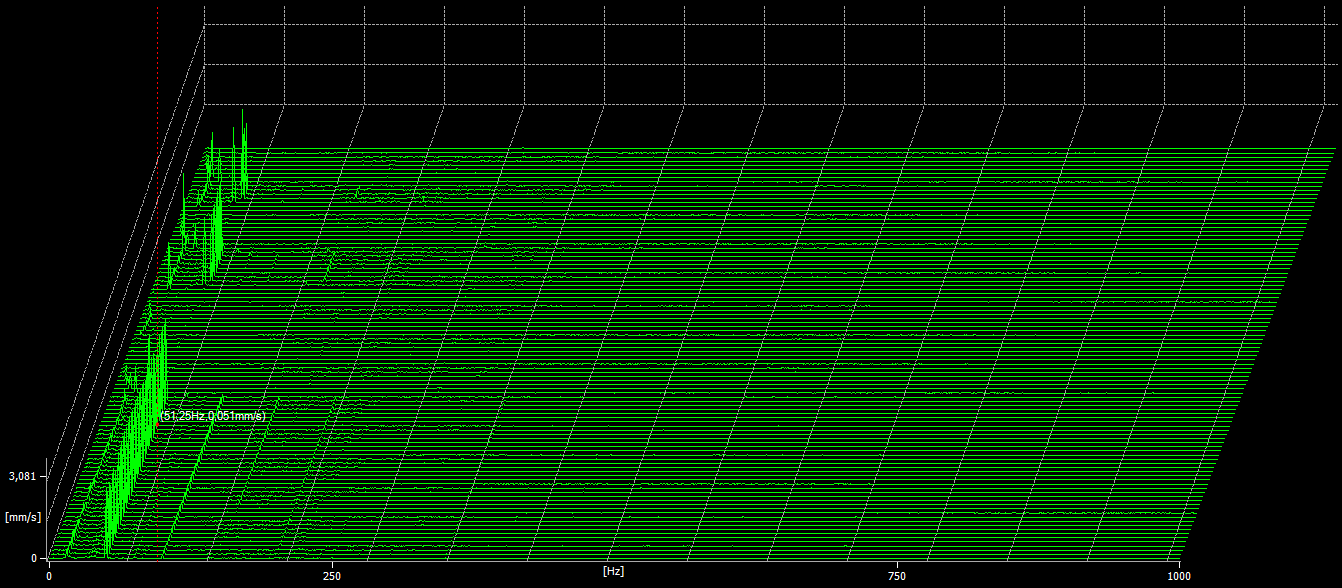
Below you can see the corresponding spectral map to this period.
Details of wireless vibration measurement before a stop
Here one can see a previous graphic description.
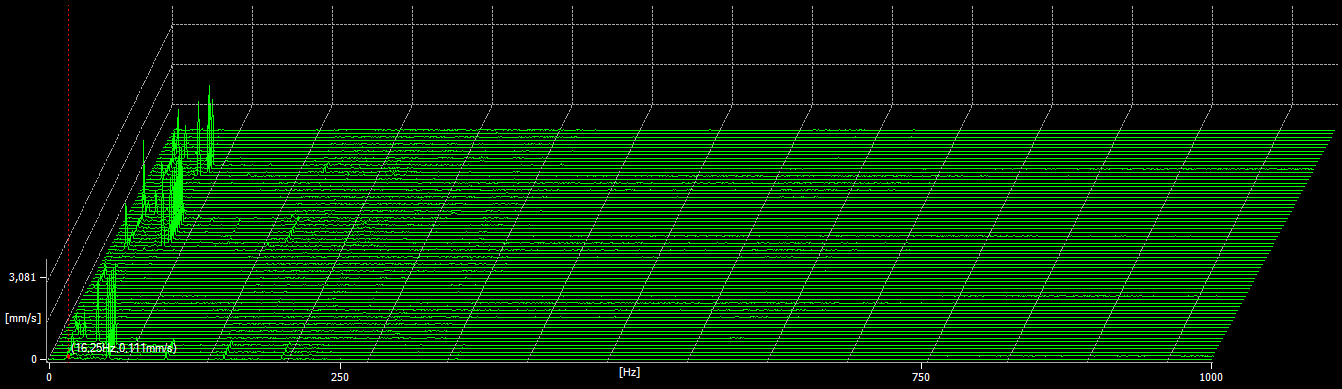
In the graph below, you can see a I any spectrum collected at the beginning of one of the stops.
In this spectrum, one can see that the sub-synchronous component is predominant and corresponds to approximately 72 microns peak-to-peak, absolute vibration. This vibration, measured with a relative vibration sensor, would be, probably, much more.
In these charts you can see that:
- The component of rotational speed, a 50 Hz, It is almost always predominant;
- There is a permanent sub-synchronous vibration 16,25 Hz, almost always less than synchronous vibration;
- some moments, to coincide with the stops, sub-synchronous component, becomes predominant.
This sub-synchronous component was related to instability of the oil film, driven by oil temperature variations. The height of the stops, coincides with a period of summer with very high average ambient temperature.
For this example, you can see the additional information provided by a wireless vibration monitoring system and its usefulness.
Wireless vibration measurement – a conclusion
De facto, some stops occurred because of a sub-synchronous vibration caused by the rise in oil temperature.
This rise in vibration, for being relatively small, by itself, does not justify the fact that the protective system is stopping the machine.
When investigated it was concluded that there were other additional causes that explained the stops.
This diagnosis was made possible by the ease with which a wireless vibration measurement system is set up.