Turbomachinery and proximitor.
The subject addressed in this article consists of turbomachinery and proximitor.
This article belongs to a series, which constitutes the support material for the course on vibration analysis in turbomachinery. Links to the other articles can be found on here.
1 Turbomachinery and proximitor – Introduction
The displacement sensor or proximitor, used in oil film bearings, of turbomachinery, has particularities that are very important. The measurements carried out on them are usually carried out by vibration monitors.
in turbomachinery, this type of bearings are normally instrumented with proximitors.
De facto, with proximitors, more vibration analysis techniques can be implemented. your degradation, or malfunction, can be better monitored and inserted in a Predictive Maintenance program, where the vibration analyzer has an essential function.
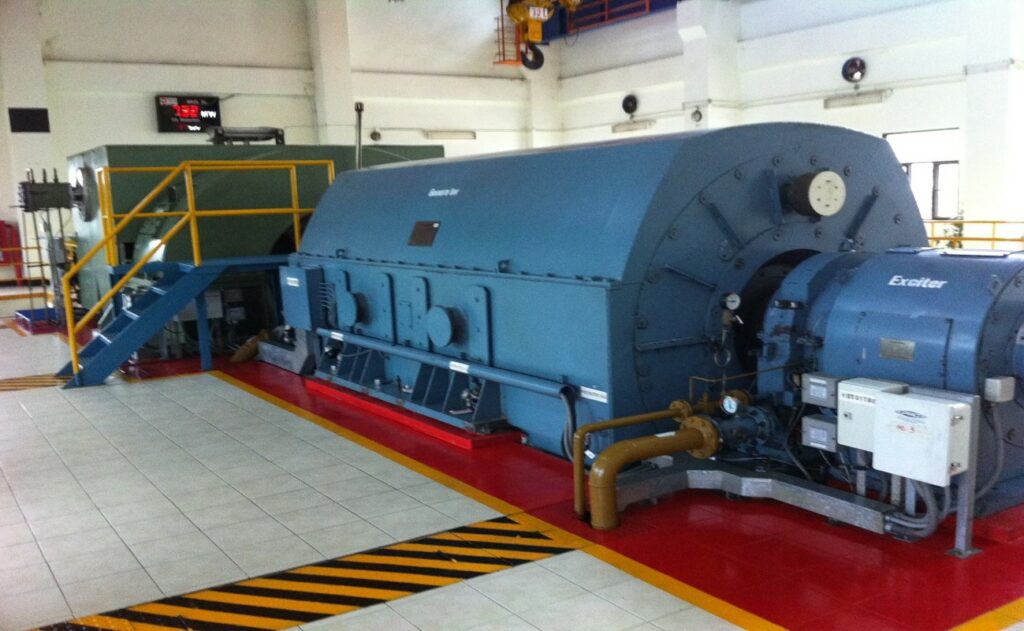
Figure - Turbogenerator with oil film bearings
2 Turbomachinery and proximitor – a little of history
Bently Nevada was the first company to successfully apply eddy current technology for use in vibration sensors, contactless shift. This type of sensor is typically used to measure very small distances between the sensor tip and a conductive surface., like a rotating shaft. Measured displacements are extremely small, typically between a few and a few hundred microns.
At the beginning of the decade 1960, industrial users of turbomachinery started experimenting with these sensors to measure vibration. Direct observation of the vibratory motion of a machine shaft is desirable because, mostly, the shaft is the source of vibration in the machine.
Before the introduction of proximitors, this shaft movement had to be indirectly inferred by measuring the vibration in the machine housing.. While machine frame measurements can be valuable under certain conditions, machines employing fluid film bearings generally have damping and stiffness characteristics, that do not adequately transmit shaft vibration to the machine frame. Consequently, direct observation of the machine shaft (rotor) has been recognized as a more accurate method of assessing the condition of these machines.

In 1970, O American Petroleum Institute defined the proximity probe as the measuring device to measure acceptable shaft vibration, during factory acceptance tests. This was added as a requirement in their standard for centrifugal compressors..
Measuring shaft vibration, using proximity probes, has become the industry standard for turbomachinery acceptance testing and machine protection. The eddy current proximity probe has become the preferred method for assessing vibration and general mechanical condition in large turbomachinery employing oil film bearings.. Such machines and types of bearings are responsible for the vast majority of compressors., turbines, bombs, electric motors, generators and other rotating equipment greater than 1.000 HP, and can be found in abundance..
currently the norm API 670 which covers the minimum requirements for a machine protection system (MPS) measuring radial shaft vibration, carcass vibration, shaft axial position, rotation speed, piston rod drop, phase reference, over-speed, surge detection and temperatures (such as anti-friction metal and motor windings). Covers hardware requirements (transducer and monitor systems), installation, documentation and tests.

It is the reference standard for protection systems of all types of big turbomachines.
3 Proximitor main features
This type of sensors has the following characteristics:
• Relative displacement sensor (came in relation to the bearing).
• Sensitivity is often 200 mV / thousand (8 mV/micron).
• The DC signal is proportional to the distance from the top of the probe to the shaft.
• The AC signal is proportional to the vibration.
• Negative power supply of 24 volts.
• Distance range: 5 a 80 mils.
• Flat frequency response.
• Sensitive to shaft imperfections (runout), both mechanical and metallurgical. – “Mechanical” and “Electrical” Deviation.
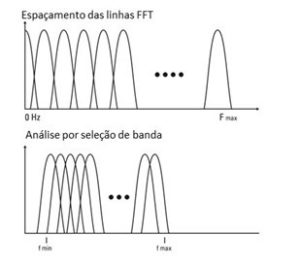
4 Characteristic curves of proximitors
The following figure shows a typical calibration chart for a given material and transducer. The object distance in proportion to the transducer tip is given by the abscissa (x axis) and the output voltage of the conditioner is given by the ordinate (eixo and).
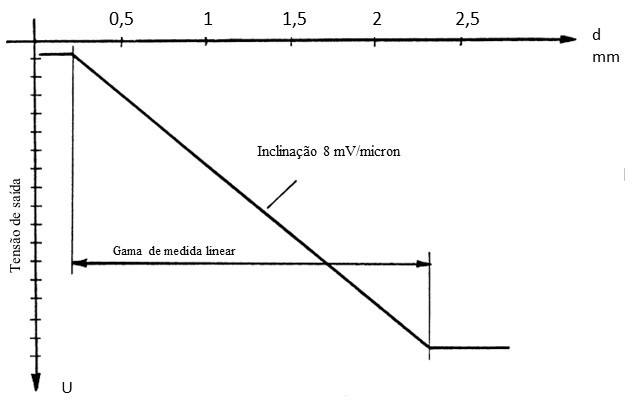
Figure – Typical calibration graph – as distance increases voltage becomes less and less
during installation, the transducer is located at an optimal distance from the target, that is, in the middle of the linear measuring range. This is called the starting distance. (GAP adjustment).
If the target moves, leading to variations in the distance d separating it from the transducer tip, the output signal of the conditioner is not constant, but varies in direct proportion to the target's peak-to-peak movement.
The slope of the U function [voltage] = f (d) [distance] determines the sensitivity of the system.
Let's consider the following example:
• The movement is 100 µm pico to pico. The sensitivity of the system is 8 mV/µm and the output voltage of the conditioner for the initial distance is -9 V.
• The dynamic voltage variation at the conditioner output is proportional to the distance variation, that is:
O 8 mV/µm x 100 µm = 800 mV peak to peak
• The output voltage, therefore, oscillates between -8,6 V e -9,4 V with an average voltage of -9 V.
Alternating voltage component indicates target vibration on either side of starting distance, as shown in the following figure. Representa, therefore, the dynamic movement of the target.
The peak-to-peak amplitude represents the total vibration distance of a shaft, that is, from the shortest distance to the longest distance from the transducer. This dynamic signal can be employed for measurement or monitoring purposes..
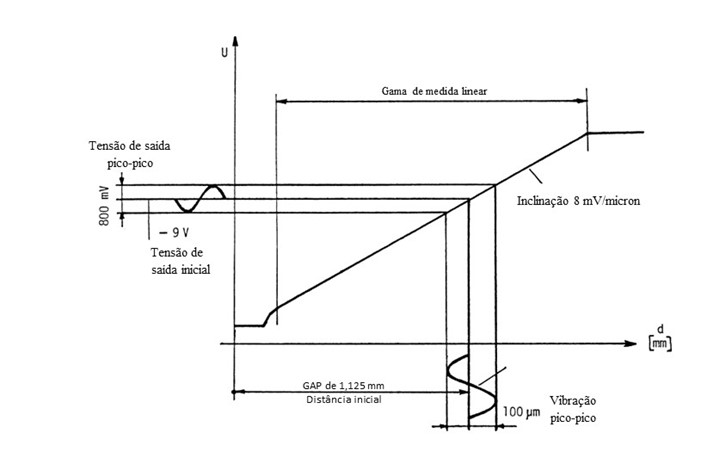
Figure - Measurement of the relative movement between the sensor and the shaft
5 Principle of operation of a proxy
The working principle of proximitors is as follows:
• As the shaft moves across the surface of the probe, the magnetic field is absorbed by the surface of the material
• Eddy currents are formed in the shaft material, attenuating the probe coil field.
• As a result, changing the range of the DC voltage then converts that value into a signal of 200 mV / mil AC.
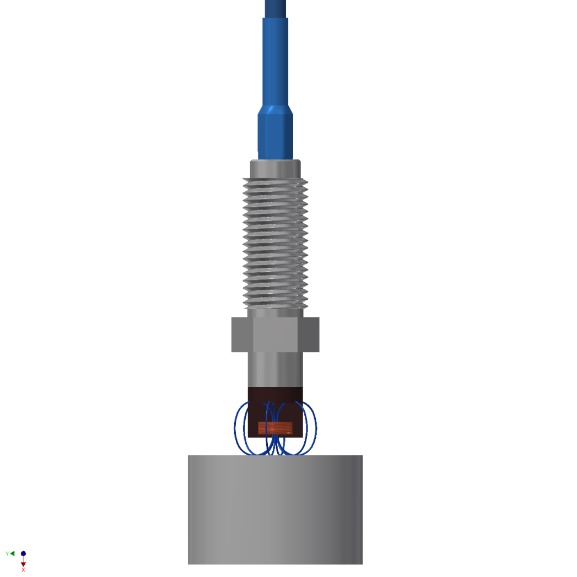
Figure - Principle of operation of a proximitor
6 Constitution of a proximitor
A complete proximity probe system consists of:
• a probe,
• extension cable
• driver

Figure - Constitution of a displacement measurement system with proximitors.
The probe has a stainless steel housing that contains the sensing element. (clock). Tip secures a finely wound coil of wire.
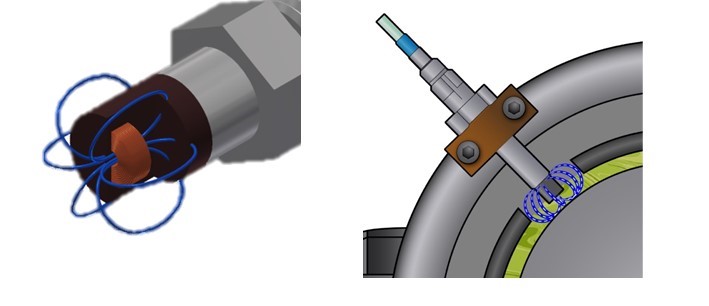
Figure - Constitution of the sensor of a proximitor
The driver powers the probe which supplies power to the probes coil, supplying the coil with an AC signal in approx. 1 MHz. This excitation produces a magnetic field that radiates from the probe tip..
The signal is then processed by the system driver.
7 Pros and cons of proximitors
The advantages and disadvantages of proximitors are as follows:
Benefits:
• No contact.
• Measures relative shaft vibration.
• Measures shaft centerline position (DC clearance).
• Measures axial position (impulse).
• Flat DC frequency response – 10KHz.
• Simple calibration.
• Suitable for harsh environments.
Disadvantages:
• The probe can move (vibrate);
• Does not work on all metals;
• Coated shafts will give false measurements;
• Measurement is affected by scratches and tool marks on the shaft (runout)
8 – O Runout
as the next, in practice, works as a contactless comparator, the results of your measurements are always the sum of the vibrations, plus the effect of shaft irregularities.
The value of the measurements of these irregularities is called Runout.
There are two types of run-out:
• The mechanic;
• The electric.
Causes of mechanical runout:
• Improper machining of journals (egg shape).
• Warped rotor (thermal or mechanical).
• Surface irregularities – scratches, bumps, imperfections.
•
Causes of electrical runout:
• Localized magnetism.
• Alloys on metal shaft are not evenly distributed (low quality material).
• Concentration of residual stresses.
The probe measures total runout = mechanical + electric
Care must be taken to prepare the target area of the shaft and protect it.
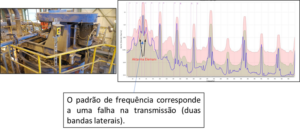
On the displacement waveform (in microns) measured with a proximitor, then presented, you can see the effect of runout on the wave and its spectrum.
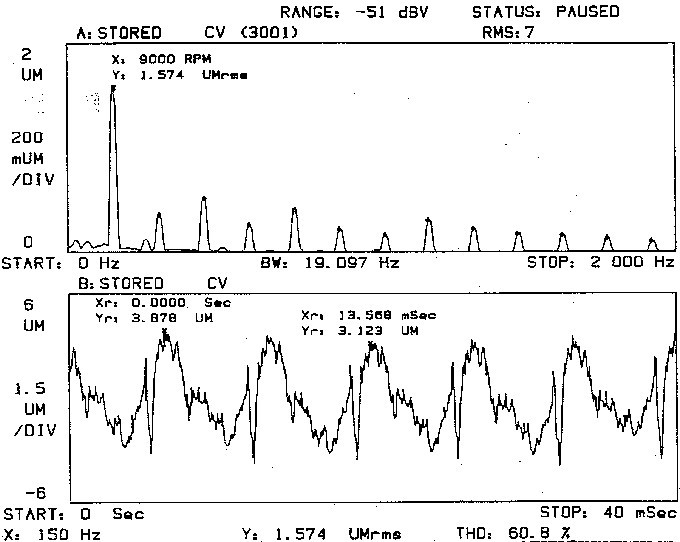
Figure 6 – Waveform and spectrum of a vein with a scratch, measured with a proximitor
In the wave you can see the effect of a scratch on the shaft, and in the spectrum one can see the numerous harmonics generated by the existence of this risk.
In the figure below, you can see a shaft with a, which geometrically is circular, but whose base material is ovalized.

Figure - Ovalized shaft with circular coating
This ovalization will cause a runout with waveform effects.
9 Turbomachinery and proximitor – a Vibration Analysis
The time signal provides important and useful information, how they are carried out, this information is limited. In this type of movement, on anti-friction metal bearings, where the oil film dampens vibrations in the bearing housing, the signal in time, supplied by an accelerometer, it is not the most suitable.
To monitor this movement, displacement sensors that measure the relative vibration between the shaft and the housing, are more suitable, especially when installed in pairs.
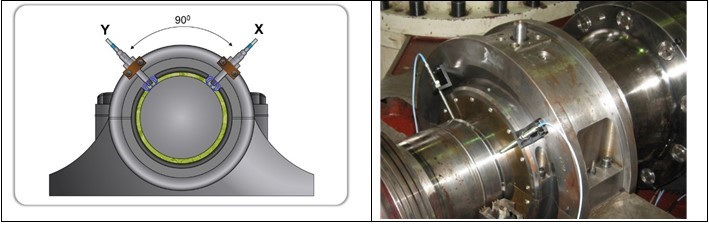
Figure - Vibration monitoring with proximitors in machines with oil film bearings
With two relative vibration displacement sensors (proximitors) there are conditions to know the movement of the center of the shaft in this plane.
This information can be seen in two different ways.:
• Average position of the center of the shaft in its play in the bearing
• Spindle Center Movement – Orbit
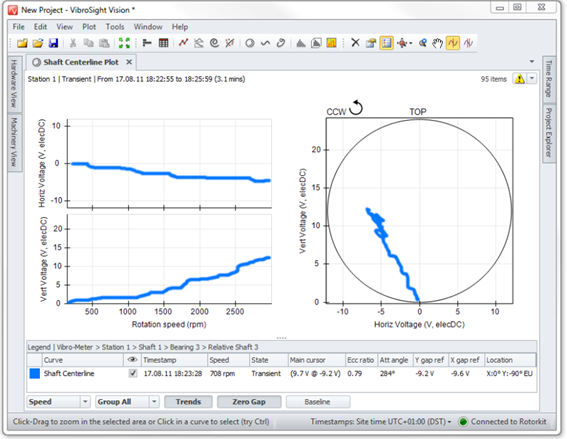
9.1 Turbomachinery and proximitor – Average position of the center of the shaft in its clearance in the bearing (Shaft Centrer Line – SCL)
Shaft centerline graph displays average shaft position due to changes in static radial load or rotor stiffness characteristics.
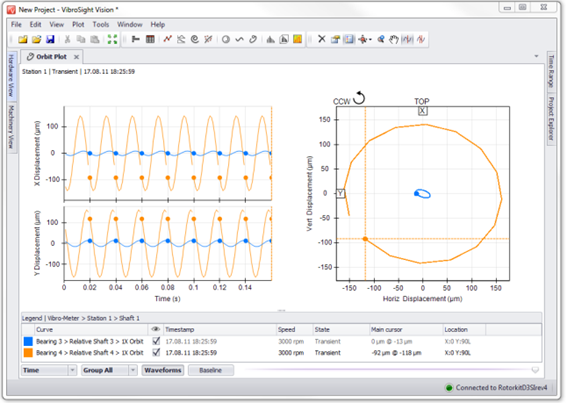
9.2 Turbomachinery and proximitor – Orbit
The movement of the shaft center can be displayed in two individual time signals, respectively to each sensor, more or ideal, is to obtain a graph that represents the two dimensions of the movement of the shaft. This graph is designated by orbit.
The orbit represents the path from the center of the shaft in the reading plane of the pair of proximity sensors.
The sensors are rigidly mounted on the machine frame, next to the support areas of the shaft (bearings). Like this, the orbit represents the trajectory of the center of the shaft relative to the structure of the machine.
Due to the easy interpretation and amount of information that the graph contains, the hourglass, reconciled with a phase indicator, also known as a phase sensor, is an effective graph to understand the physical phenomena that occur on rotating machines.
10 – The physical meaning of relative and absolute vibrations
The relative vibrations measured by a pair of displacement sensors indicate:
- The relative movement of the shaft relative to the bearings;
- The movement of the center of the shaft.
the absolute vibes, measurements on the bearings, indicate the forces transmitted by the shaft to the bearings.