vibration analysis and envelope
vibration analysis and envelope
This article explains that consists in vibration analysis and envelope.
The envelope analysis is, currently, the tool par excellence, for detecting faults in bearings for Vibration Analysis. It has also become essential to diagnose any mechanical problems that can lead to shock, such as gears dilapidated, days off, desapertos, etc.
Originally, when it was developed did not have the ability to measure, with accuracy, the level of acceleration generated by mechanical impacts, but, since the nineties, with the development of detection technology impact peaks, this limitation is exceeded.
The envelope with vibration analysis techniques have had various commercial designations and, namely:
- PeakVue (Emerson/CSI);
- Espectro de Spike Energy (IRD/ENTEK/Rockwell Automation);
- demodulation;
- Envelope;
- Etc.
However despite the different names and how to implement, all continue to provide envelope analysis versions and is typically implemented with a vibration analyzer. 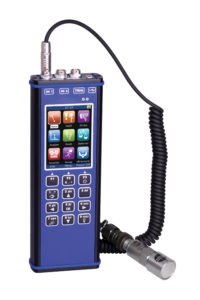
2 The limitation of the measuring vibration speed for the predictive maintenance of bearings
The assessment of the severity of the vibrations in mm / s rms is an essential parameter to know the operating condition of the machines, when it comes to imbalances, desalinhamentos, days off, etc.
However, when it comes to bearing condition monitoring speed in vibration analysis does not provide a warning with adequate advance, that it is intended to be a few months (no minimum)
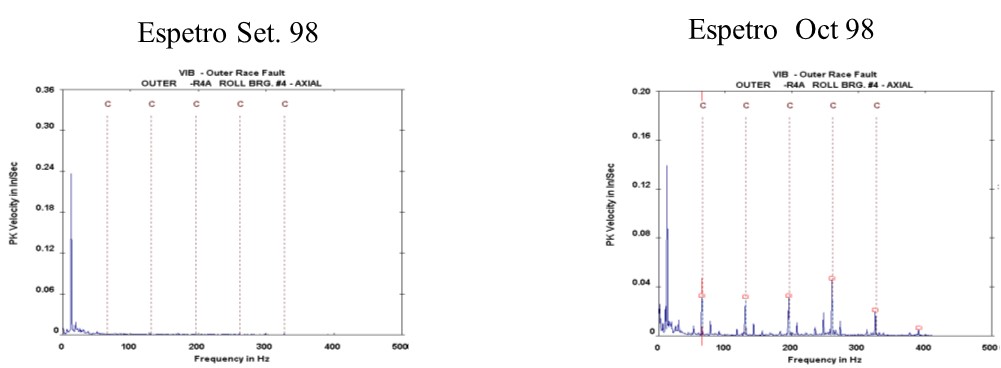
Figure 1 – The assessment of the severity of vibrations in mm / s RMS does not provide a warning with adequate advance
So the analysis is performed in acceleration.
However to make the analysis of vibrations of machines of bearings has to be taken into account with other factors.
3 - What interests us know in diagnosis of faults in bearings a vibration analysis
In the fault diagnosis on vibration analysis by interested in bearings in essentially two parameters:
- The exact amplitude of the resulting vibrations peaks generated by the impact severity of defects for review purposes
- Yours Frequency >>>> frequency for diagnosis and assessment of severity.
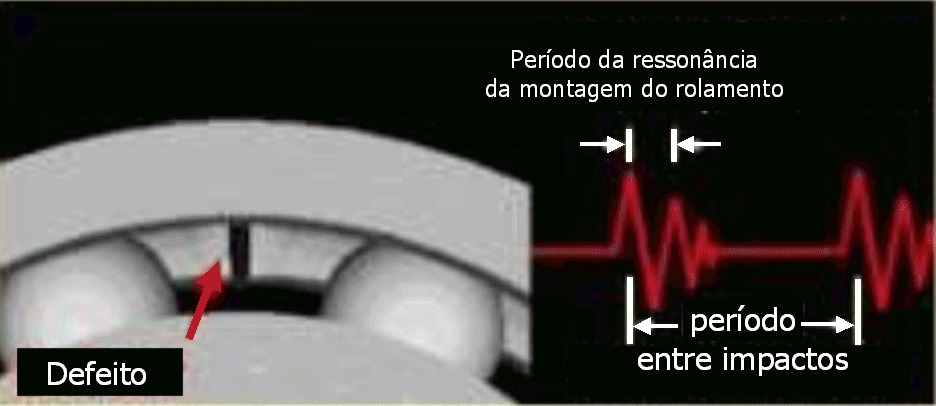
Figure 2 - what interests us in the failure analysis of vibrations in bearings
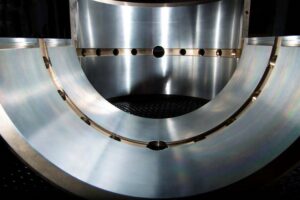
4 - The characteristics of vibrations in machines where bearings are installed
The machines have significant level of vibration in the low frequency masking and emerge mixed with the lower extent of damage to bearings
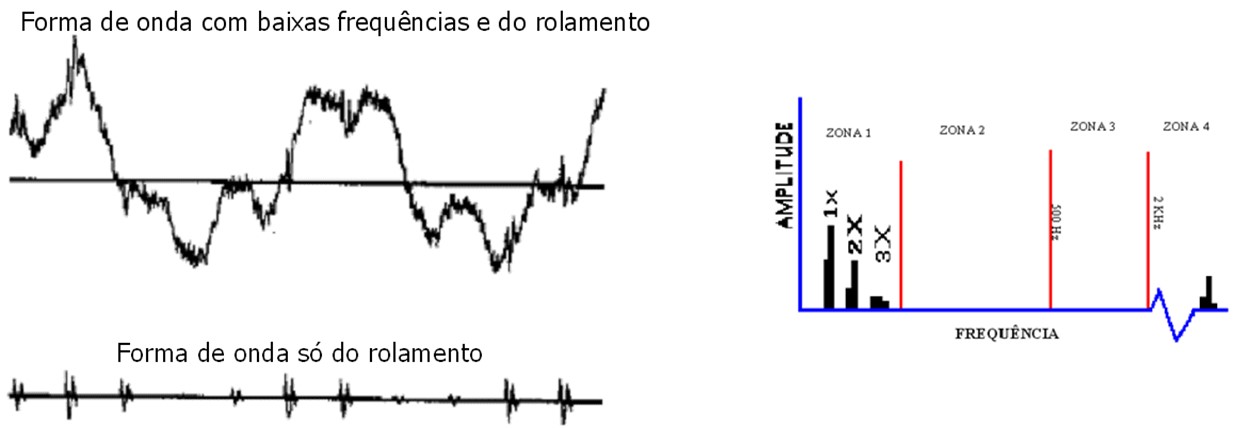
Figure 3 - waveform and frequency spectrum of vibrations in machines
Comes with obvious that, ideally, It would be interesting to separate the vibrations of the bearings of the other vibrations of the machines.
Below you can see a video about vibration modulation.
5 - vibration and envelope Analysis – The separation of vibrations of the bearings of the other vibrations of the machines
As the vibrations in the bearing degradation, in its early stages, arise especially in acceleration, at high frequencies, It can be done separation / enhancement of vibration in bearings, by using a high pass filter of the vibrations measures. Right hand shape can be effected separation of the bearing vibrations of the other machine vibrations.
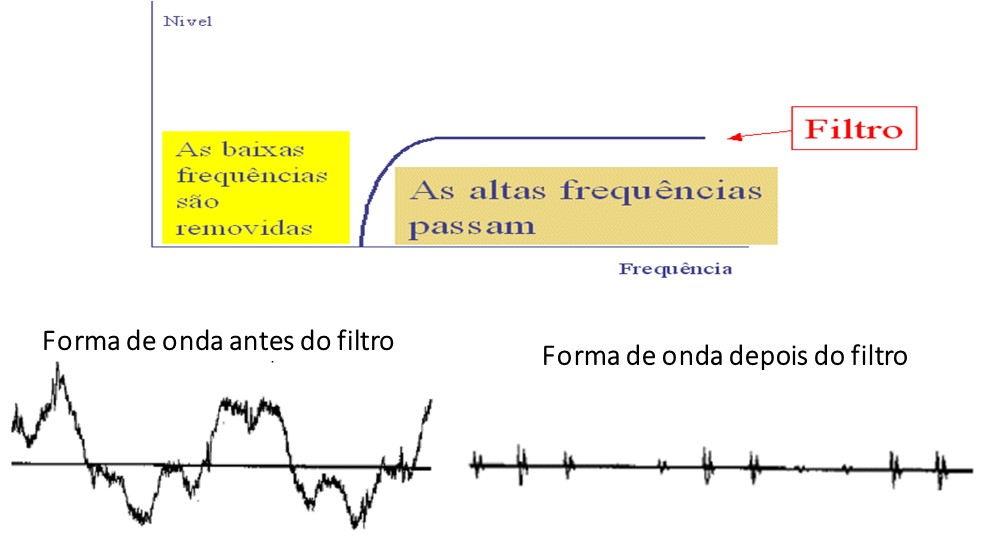
Figure 4 Vibration elimination at low frequencies – filter input high pass
This filtering operation is the first envelope with the vibration analysis.
6 – The characterization of the repetition rate of impacts on the bearings.
To meet shock repetition period of the envelope analysis rectifies the waveform before performing the FFT spectrum.
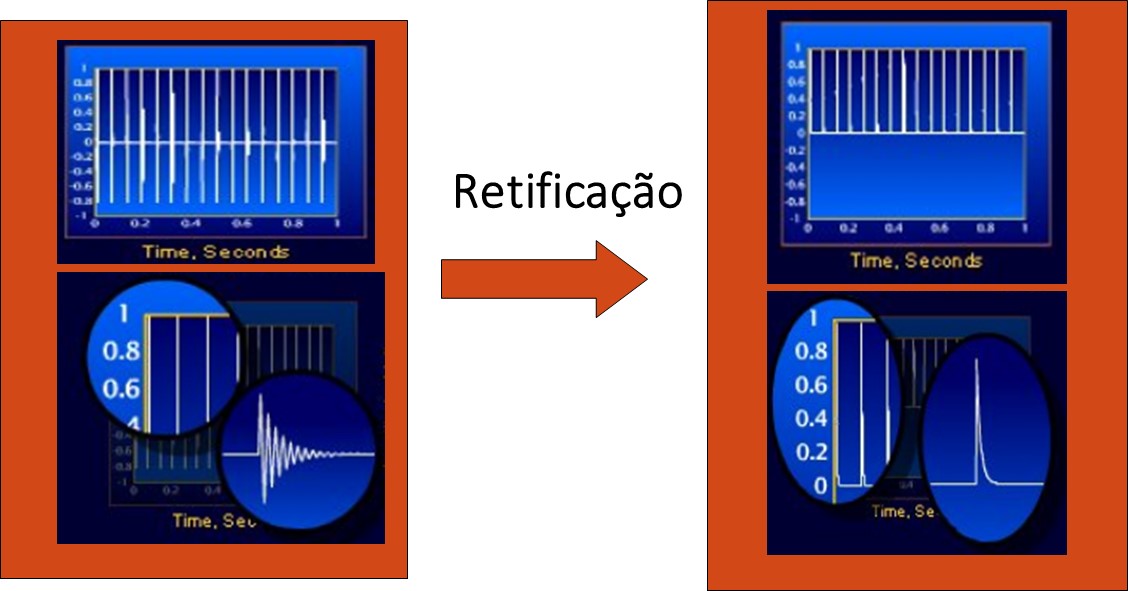
Figure 5 - The correction waveform
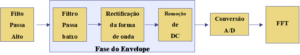
7 - vibration and envelope Analysis – obtaining envelope of the frequency spectrum
The frequency of vibration analysis is performed on the rectified waveform, There was thus having the following diagram of vibration analysis blocks with envelope.
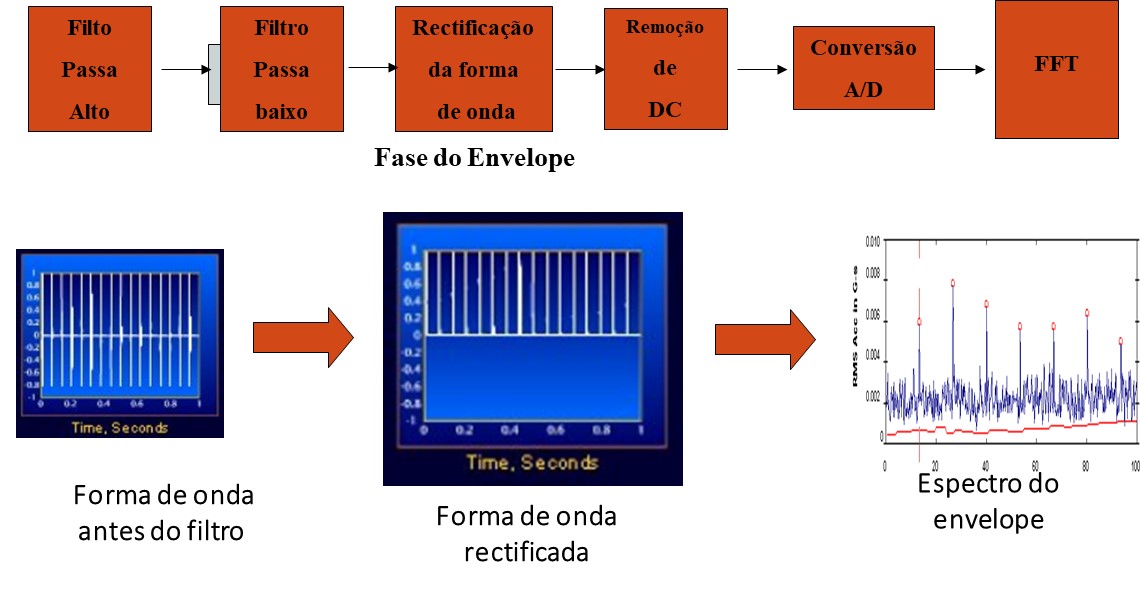
Figure 6 - implementation of Scheme envelope with vibration analysis.
8 - The appropriate sampling rate to characterize the peak amplitude of the waveform
The bearing damage arise in terms of vibrations on how well evident in the waveform shocks.
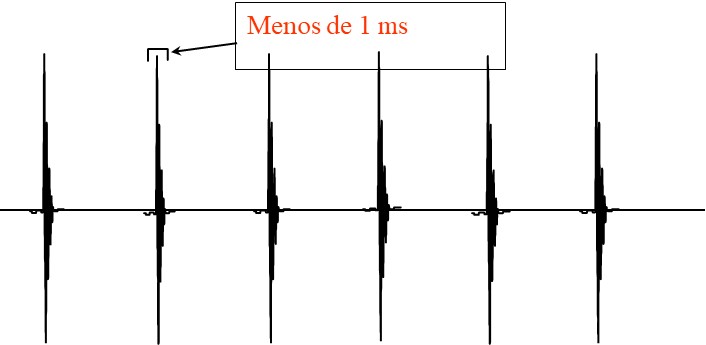
Figure 7 - Impulse vibratory (accelerating) resulting from a failure in the bearing
Let's imagine that a bearing, rotating at low speed, we want to measure a spectrum up 100 Hz. For this, typically, the analog-digital converter of a spectrum analyzer will get a waveform sampled the 2,56 x 100 Hz = 256 Hz, that is, the waveform will consist of samples obtained from 4 in 4 ms. This is insufficient to adequately measure the peak amplitude of the shocks.
In the following figure one can see an example of a waveform with an insufficient number of samples and that its scope is not adequately characterized.

Figure 8 - The importance of the sampling rate for exact measurement of vibration amplitude caused by shocks caused by faults in rolling bearings
To adequately characterize a shock that lasts less than one millisecond have to take at least 10 samples per millisecond, for example. we have, therefore, in order to properly characterize the amplitude of a pulse lasting one to require up-millisecond sampling frequency 10 KHz, which corresponds to a maximum frequency in the spectrum, of 4 KHz.
If this rule is not followed amplitude which appears on the waveform and thus the spectrum is not well characterized.
9 – The frequency resolution needed to identify the frequency of defects in bearings
On the other hand, it has to be a spectrum of 4 KHz does not have enough resolution to clearly identify the defect frequencies.
It has been so that the fixed relationship between sampling in time and frequency range, intrinsic mathematical function of Fourier transform, obtained with the FFT spectrum, It prevents us from having both simultaneously:
- A high sampling enabling us to properly measure the levels of impact peaks;
- A high resolution in the frequency spectrum that will allow us to clearly identify the frequency characteristics of defects in bearings.
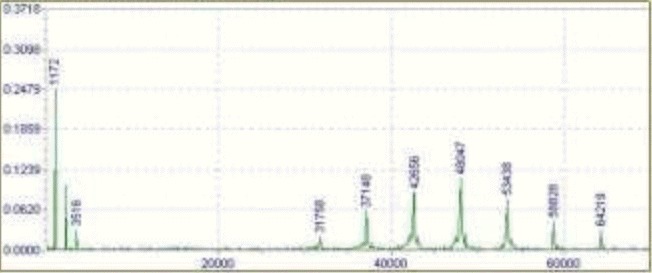
Figure 9 – To get resolution to be able to observe the characteristic frequencies of the bearings when you set the frequency spectrum Maximum, is set to a sampling rate of wave form of inappropriate to characterize its amplitude.
Below you can see a video about vibration demodulation.
10- The measured amplitude and response time of the rectification waveform of vibration analysis with traditional envelope
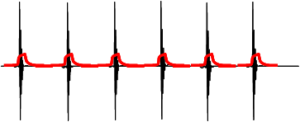
Another issue that must be taken into account is the envelope correction response time.
 |
 |
|
c) Signal after rectification (red). |
Figure 10- rectification Response time envelope with vibration analysis
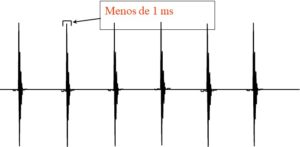
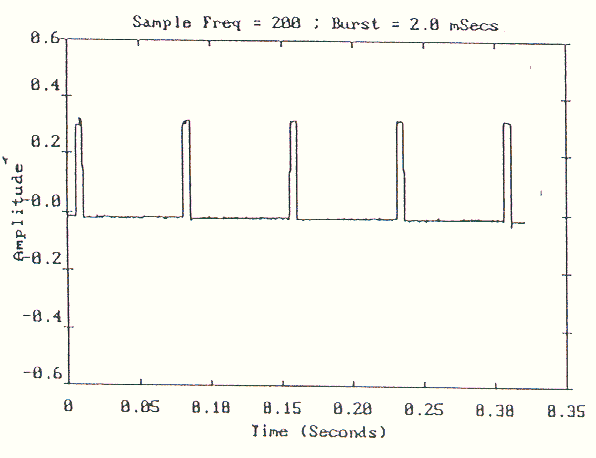
Take the following example of a signal 10 KHz lasting 2 ms issued 10 times per second
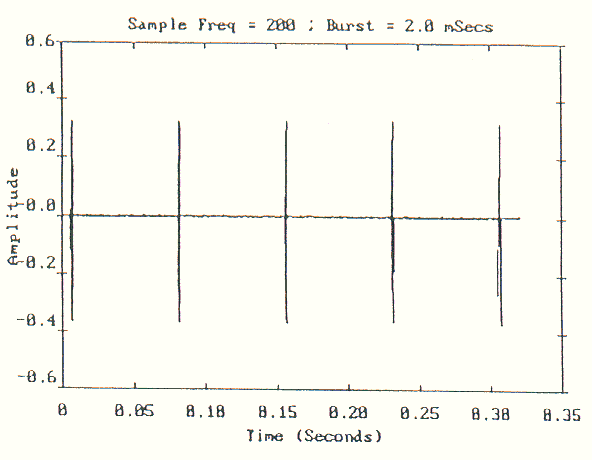 |
original signal – 10 KHz lasting 2 ms issued 10 times per second |
 |
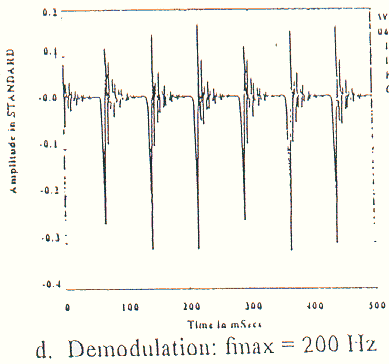 |
| Sampled and rectified frequency Fmax. de200 Hz | sampled 2,56 Fmax de 200 Hz |
 |
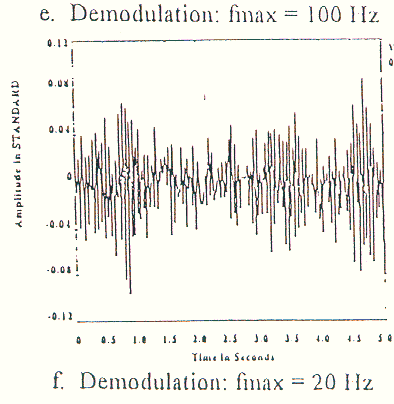 |
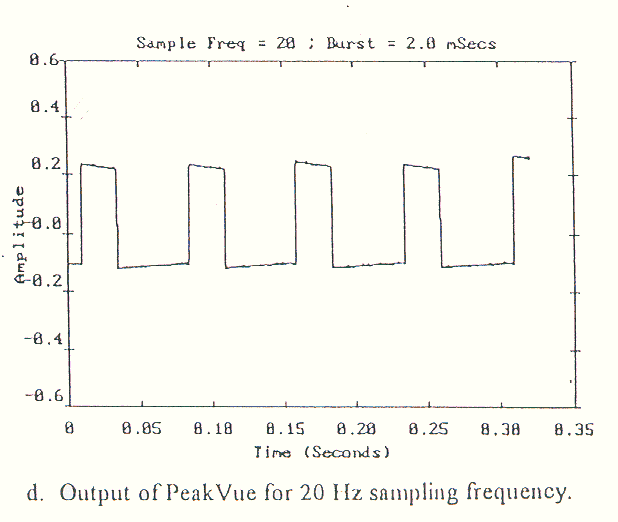
| Sampled frequency and rectified with F max 20 Hz | sampled 2,56 F Max 20 Hz |
Figure 11 – One can see that as the low frequency sampling the measured level is lower eDo not correspond to reality.
In the traditional way of implementing the envelope analysis and in most equipment rectification made in the envelope with vibration analysis, It is not fast enough to keep up with the speed of real physical phenomena to be measured.
It has been so traditional envelope analysis can not accurately measure the amplitude of very short duration events.
11 - The correct measurement of peak amplitude envelope waveform – digital detection impact peaks
The latest way of measuring the peak amplitude envelope is to first sample the waveform at high frequency (for example 100 KHz), regardless of the maximum spectrum frequency, to ensure that properly measure the extent of the impact of peaks.
Then these samples are used to reconstruct a waveform that will serve the construction of the frequency spectrum. This reconstructed waveform retains May each sample value of all samples that gave rise to. This technique is used by CSI, SVD e ADASH.
Below follows a block diagram thereby envelope analysis.
With this approach measuring the amplitude of peaks in the waveform and spectrum components of correct values.
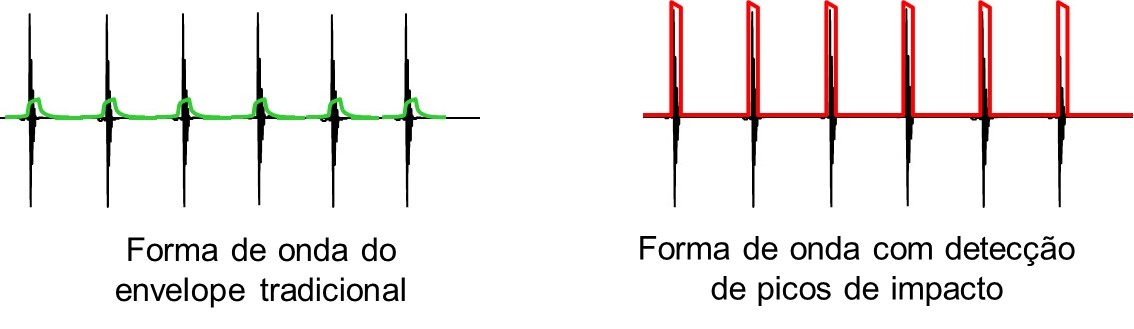
Figure 12 - Rectification of the waveform with digital detection impact peaks
12 – Advantages of digital detection impact peaks in thenalysis vibrations and envelope
The advantages of digital detection of impact in peak envelope with vibration analysis arise in different circumstances.
- Machines running at low speed
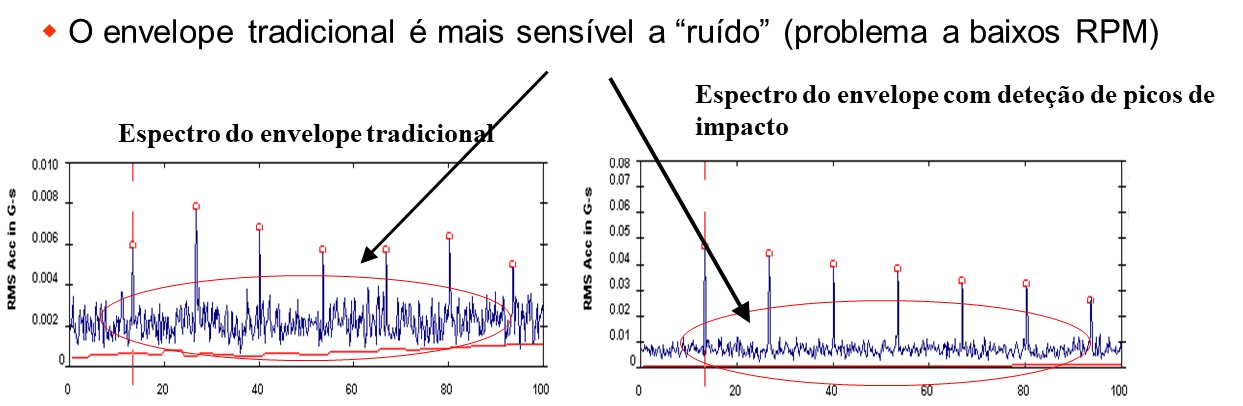
Figure 13 - The envelope analysis with digital impact peak detection has less noise
- Measuring correct amplitudes
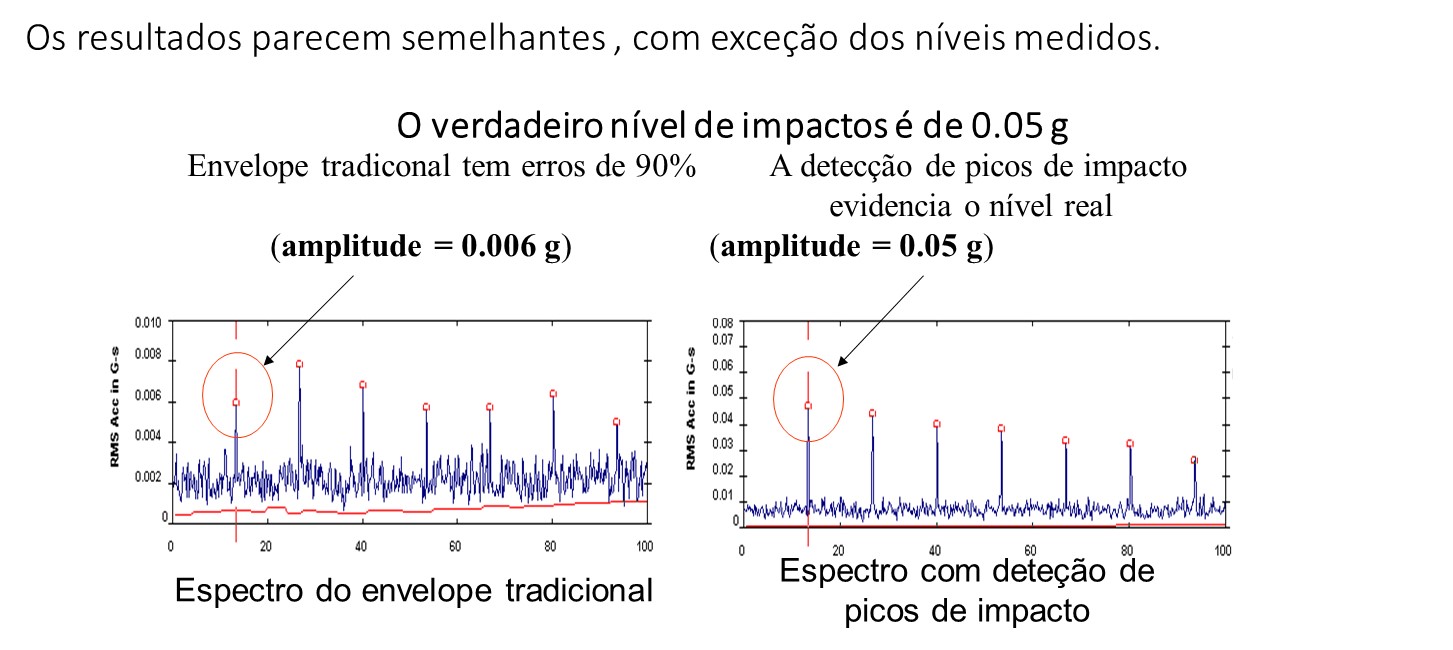
Figure 14 - The envelope detection, with digital impact peak detection, measuring the correct amplitude
- Waveform display
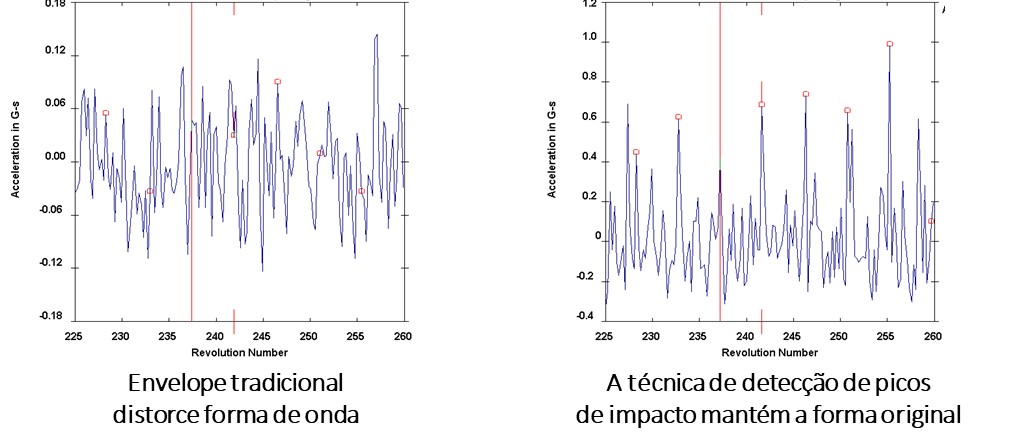
Figure 15 - The traditional envelope distorts the waveform
Vibration analysis envelope detection with impact detection peaks allows the physical interpretation of the phenomena that give rise to the waveform.
- Machinery at high rotational speeds
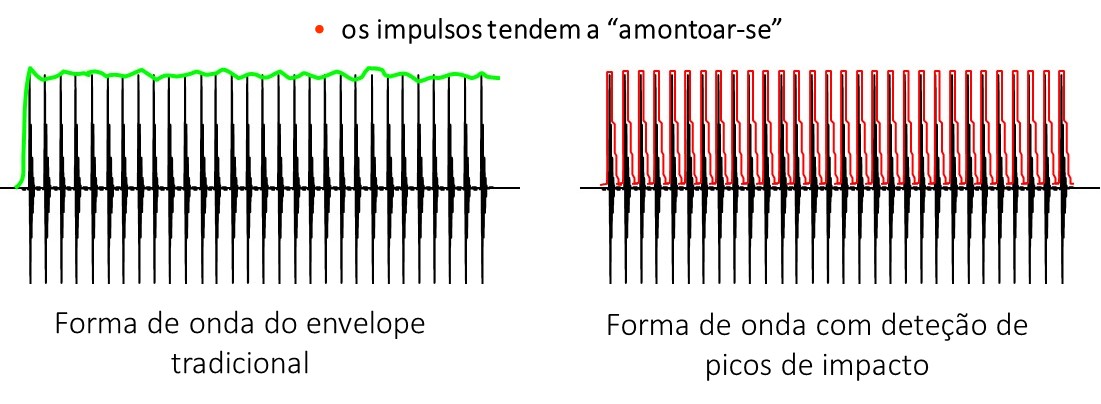
Figure 16 - With traditional envelope impulses "Join"
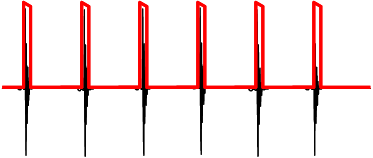
13 - Diagnosis on the waveform and envelope with vibration analysis
The impact detecting peaks in the waveform provides crucial diagnostic information:
- Chains and cranes: very short cycles with speed to vary very quickly.
- Equipment with very low speed: to roll within 50 RPM
- Gears with broken teeth:
- The spectrum provides diagnosis, but…
- The waveform indicates the severity
The following can be an example of rectified waveform, gained by the envelope detection analysis technique impact peaks, a bearing defect in low speed machine, where individual impacts clearly arise, It is visible the level of individual impacts, but this information does not appear in the FFT spectrum
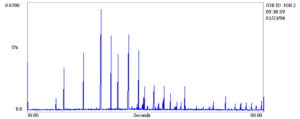
Figure 17 – Example rectified waveform gained by impact analysis envelope peak detection technique bearing defect in low speed machine
14 Comparison of the two vibration analysis techniques and envelope
In the table presented below you can see a comparison of the two techniques
| Method | Envelopetraditional | Envelope with detection impact peaks |
| circuits | analog | Analog and digital |
| answer | Late | The high frequency (Ex.: 100 KHz) |
| Detection frequency | typically good | always good |
| Level | Meaningless | Accurate and can be used for trend |
| Outputs for diagnostic | only spectrum | Spectrum and waveform |
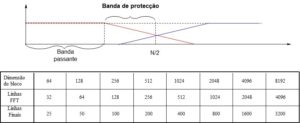
15 Rules applying vibration analysis enveloped
The following are the application of the envelope with vibration analysis:
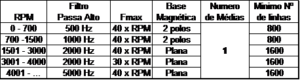
- Bearings - high pass filter the upper frequency 40 times the speed
- gears – high pass filter to the higher frequency 3,5 times the frequency of engagement
- The maximum frequency of the spectrum envelope must be less than the high pass filter, and should preferably be less than half of this.
- Beware of mounting the accelerometer!!!!
- Do not make average - increase resolution (It has the same effect of making medium)
In the table presented below one can see some application of the envelope analysis, depending on the machine rotation speed.
16 Examples
16.1 Example 1
| Machine: | electric motor of 4 250kW poles |
| Application: | mine fan drive through a reducing one story. The engine was critical to the operation. |
| issue: | Possible damage to the inner race of the bearing. |
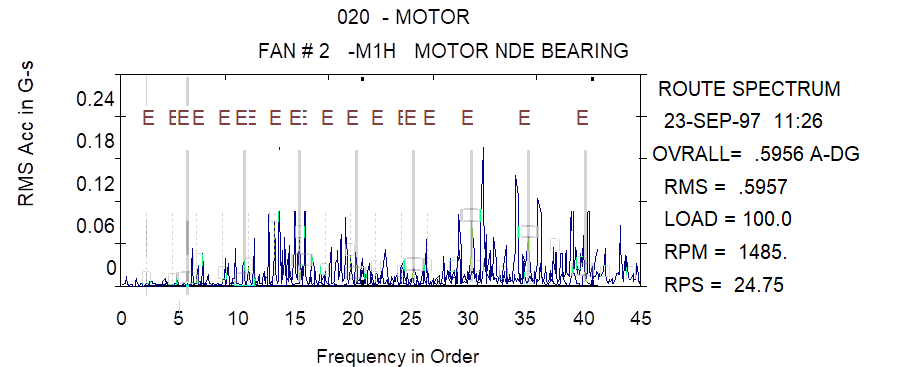 |
| normal spectrum shows defect symptoms in inner race, unclear. |
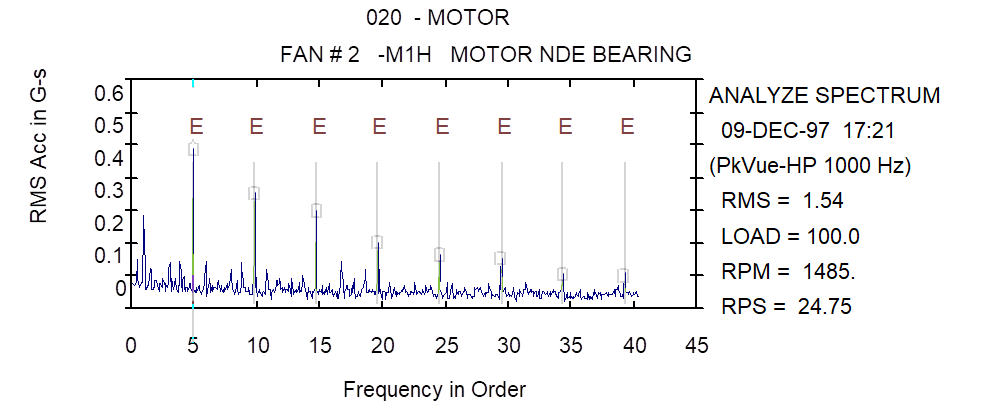 |
| Envelope spectrum shows clear symptoms of defects in the inner race. |
Figure 18 - Analysis of vibrations and electric motor in an envelope
| Conclusion | The engine was sent for review and the bearing has been inspected. We found a slot in the inner race. |
16.2 Example 2
| Machine: | The intermediate shaft gear carrier |
| Application: | mine,Rotation speed: 0 -180 RPM in seconds
measurements made between 120-160 RPM |
| issue: | The diagnosis is not possible with traditional FFT |
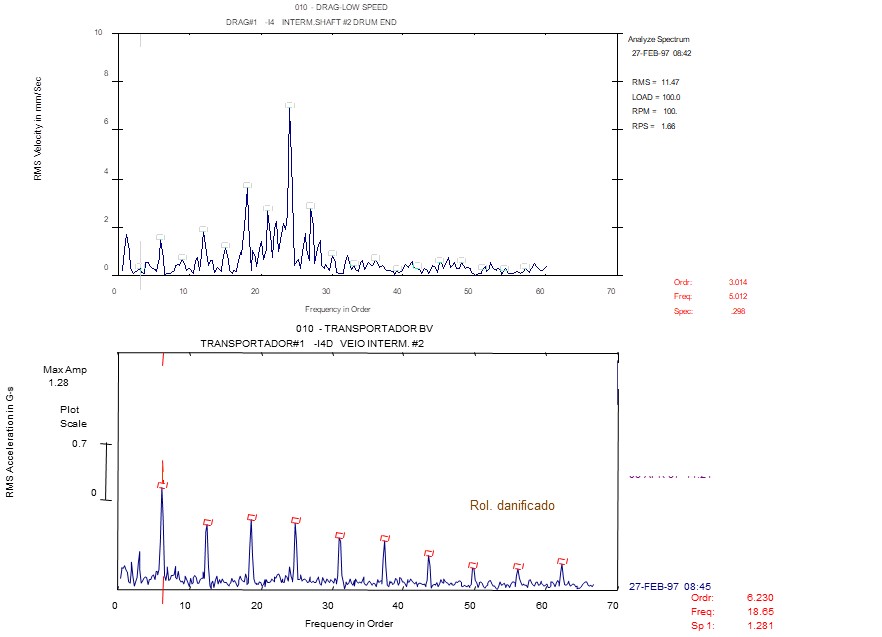 |
traditional FFT only shows a normal gear |
| The FFT envelope clearly evidence the defects outer race | |
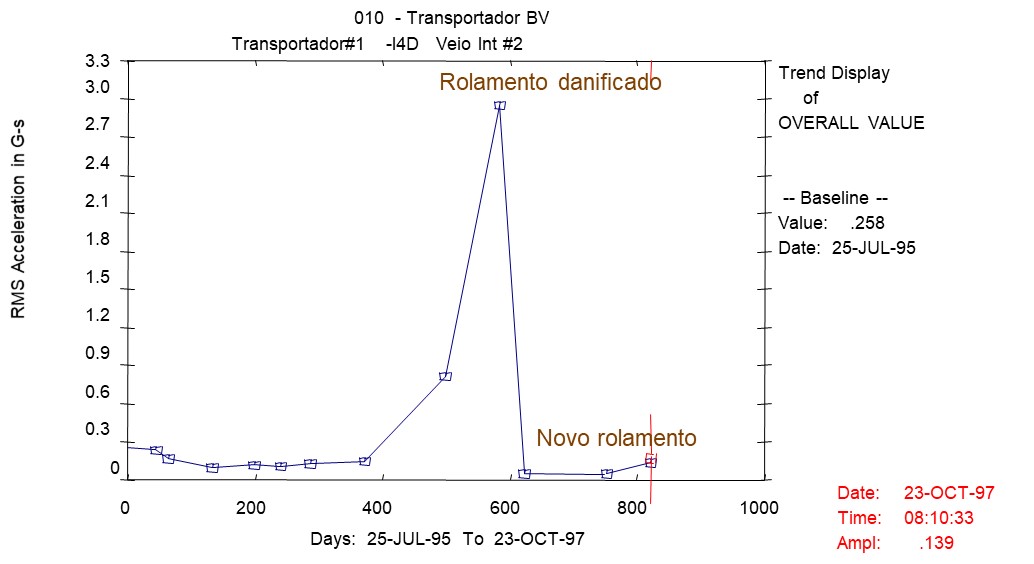 |
Strong increase in the trend level of impact peaks |
| Recommended immediate replacement bearing | |
| Vibrations return to normal level |
Figure 19 - Analysis of vibrations and envelope gear
| Conclusion | The bearing reduces vibration replacing. Inspection reveals bites and starting material in the cargo area of the outer track. |
16.3 Example 3
| Machine: | crane in gear |
| Application: | Knocking sound when changing directionCage defect is suspected |
| issue: | Normal FFT spectrum shows no defects |
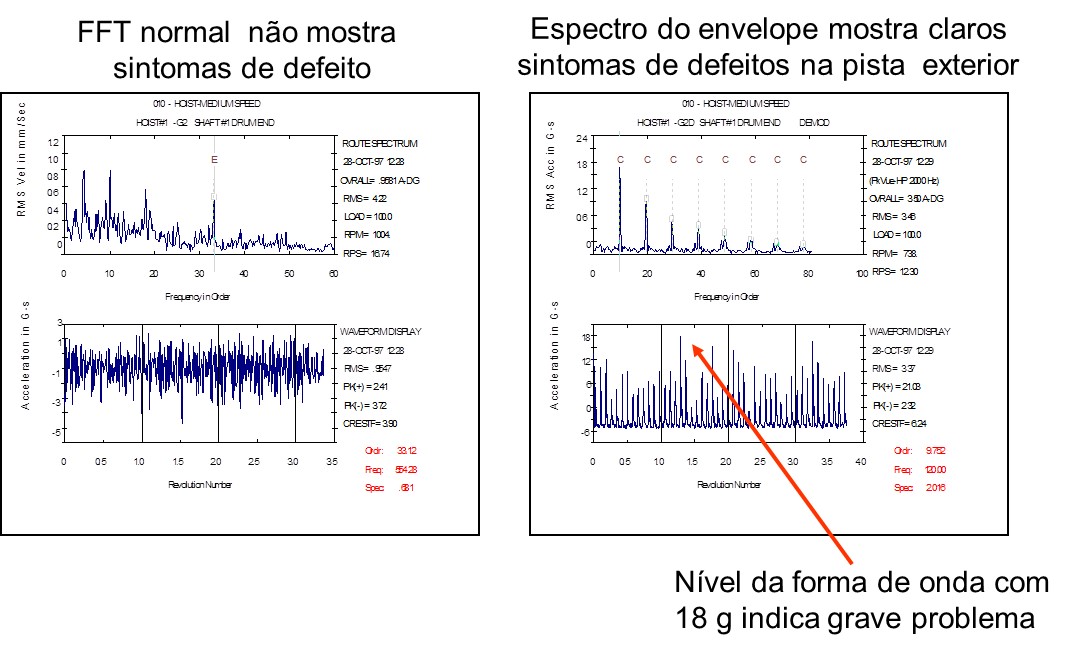
Figure 20 - Analysis of vibration and crane envelope
| Conclusion | The inspection revealed serious damage to the cargo area of the outer track |
16.4 Example 4
| Machine: | screen drive poly carrier to rotate the 33 RPM |
| Application: | Frequent breakdowns without warning Vibration transmitted from the gear masks frequency of poly bearing defects |
| issue: | The diagnosis is not possible with traditional FFT or traditional envelope |
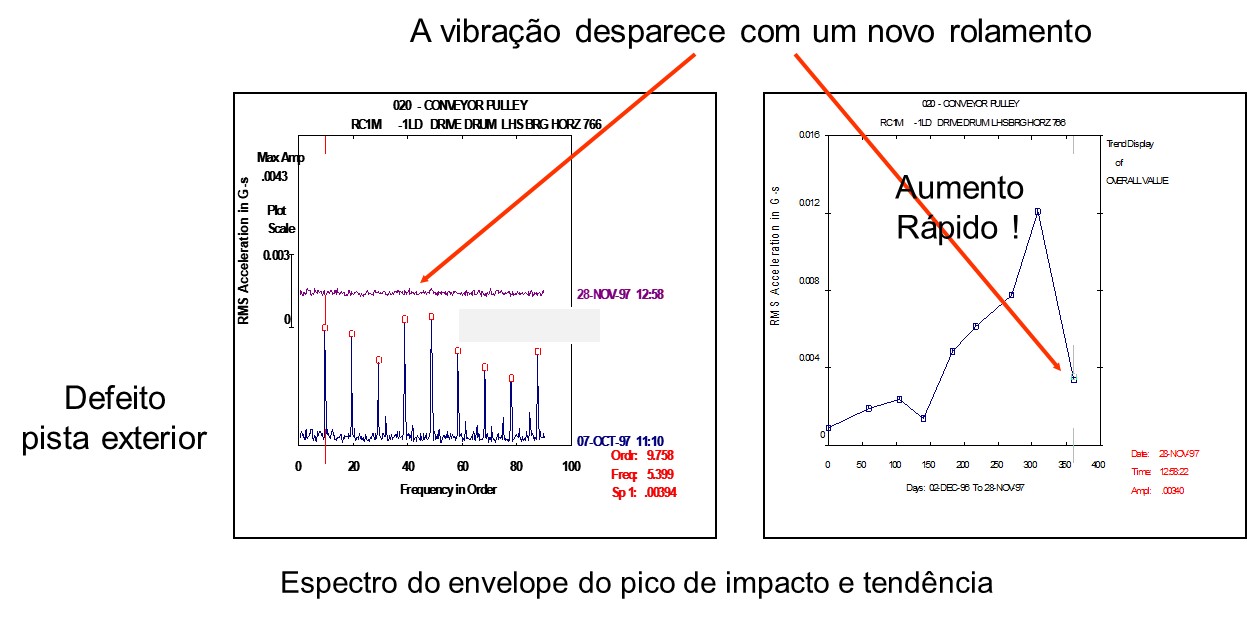
Figure 21 - Vibration analysis and envelope conveyor belt drive poly
| Conclusion: | The inspection revealed serious damage to the cargo area of the outer track |
16.5 Example 5
| Machine: | Poli screen drive carrier to rotate the 23 RPM |
| Application: | Carrier critical to the production process |
| issue: | The diagnosis is not possible with traditional FFT |
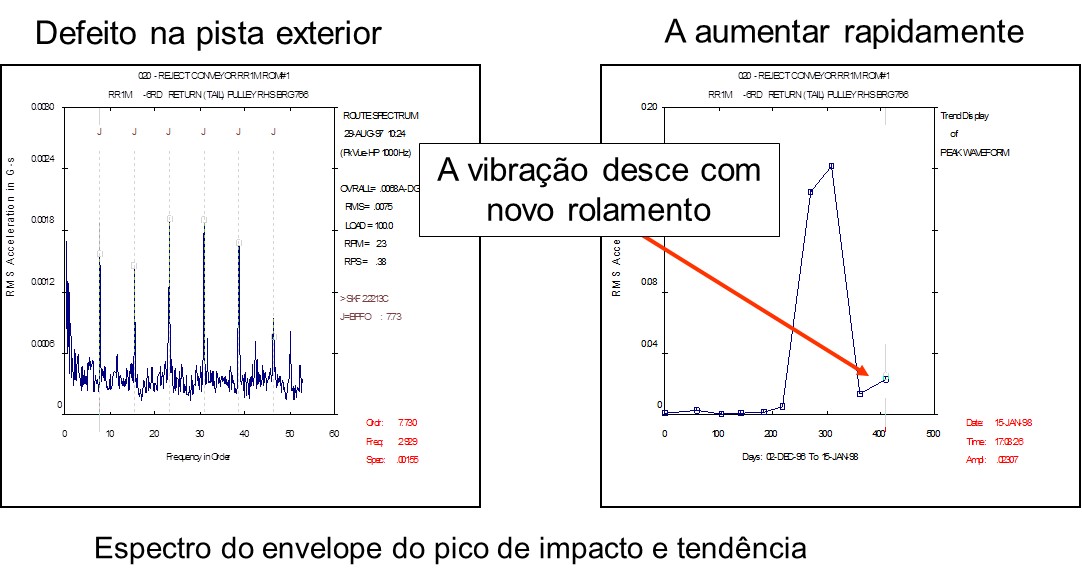
Figure 22 - Vibration analysis and envelope conveyor belt drive poly
| Conclusion: | The defect inspection revealed outer race |
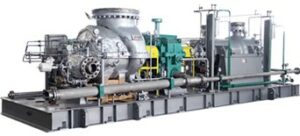
16.6 Example 6
| Machine: | Compressor Ingersoll-Rand |
| Application: | Critical for the production process |
| issue: | The diagnosis is not possible with traditional FFT |
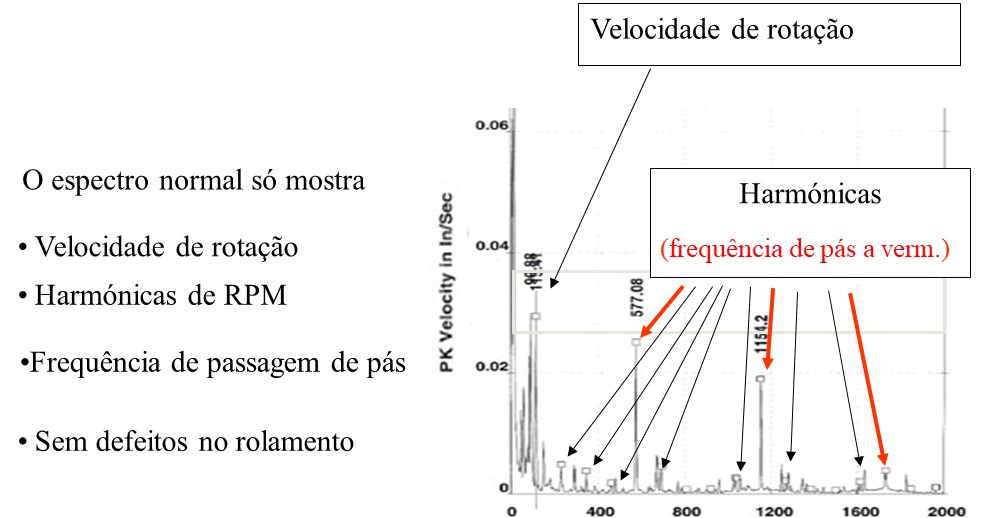
Figure 23 - Vibration Analysis compressor
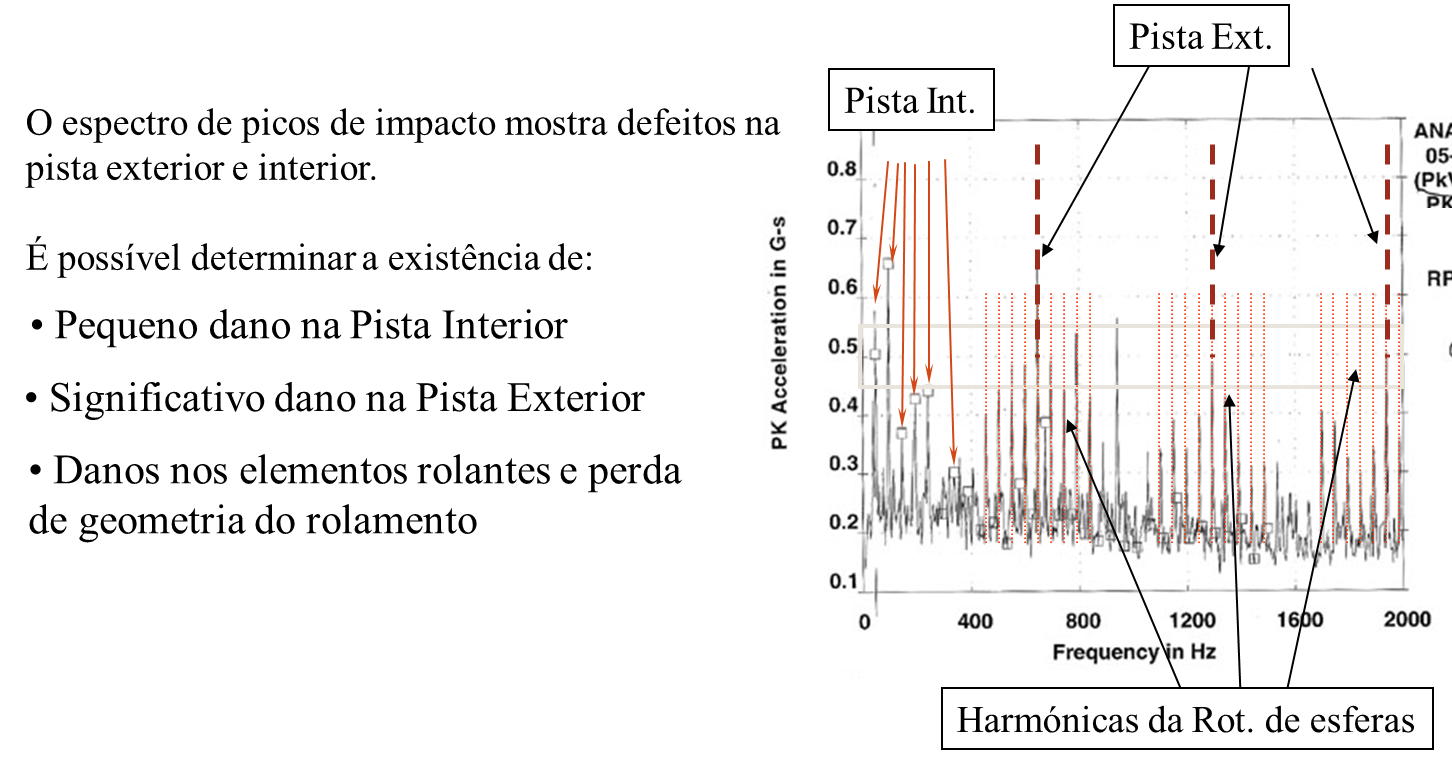
Figure 24 - Analysis of vibrations in the compressor and envelope
| Conclusion: | The inspection revealed defects in the inner and outer race of the bearing |
17 Conclusion
Vibration analysis of the impact of peak envelope is:
-
- A powerful detection tool strokes;
- Particularly in bearings and gears, but not only;
- Also effective at low rotational speeds;
- Amplitude accurate and usable to perform trend;
- Measures the actual level of impact;
- It is possible to assess the severity of damage.