MCM – Electric Motors Condition Monitoring
Analysis of electric motors with MCM technology – Electric Motors Condition Monitoring
1 Introduction
O MCM – Electric Motors Condition Monitoring is a recent electric motors analysis technology, that works based on artificial intelligence that compares the actual engine to be monitored, with a mathematical model of the engine, running up to 600 different load conditions. This mathematical model is obtained from a learning period lasting a few days.
This technology was developed for NASA to make the condition control of the main engine of the Space Shuttle.1)
The diagnostic monitoring system MCM is also designed to detect electrical faults in engines, in response to the limitations of monitoring vibrations. In addition to the electrical failure modes, also detects mechanical failure modes the engine or driven machinery. Emerges as the only alternative in situations where vibration monitoring is not practical dedicated, economic or comprehensive enough. You can detect changes in the load the motor is facing due to abnormalities in the driven equipment or process, as cavitation or clogged filters and screens.
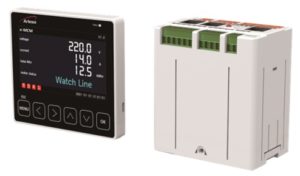
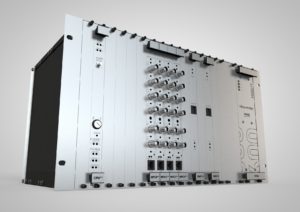
Figure 1 - A monitor MCM – Electric Motors Condition Monitoring
MCM settles in the engine power well above and, and requires no installation of the sensor on the engine itself, or driven machine, contrary to what happens when using a vibration analyzer, It is especially suitable for inaccessible or driven equipment in hazardous areas and is applicable to most types of pumps, compressors and similar machines. It is also suitable for monitoring of submersible pumps, well, downhole and encapsulated.
2 Operating principle of the MCM – Electric Motors Condition Monitoring
To perform the analysis of electric motors MCM monitor uses a combination of dynamic waveforms for voltage and current, along with learned models, to detect faults in the motor or the driven equipment. Learning is supported by an additional database, if the monitor has been installed in an already faulty engine. The monitor detects differences between the observed current characteristics and the characteristics learned and relates these differences failed.

The electric motor fault detection is based on a template engine, learned by the monitor, physics-based, wherein the constants in the model are calculated from data in real time and compared to values previously learned.
The detection of mechanical failures is based on the power spectral density amplitudes (PSD) in specific frequency bands, in relation to the learned values. This information is automatically combined with specialized knowledge in diagnosis. Because of this spectral band approach, mechanical fault detection provides guidance for a class of possible failures. Sensitivity to some flaws (for example, bearing failures of the rolling elements) decrease with distance from the component fails pathways. On the other hand, failures that increase engine load are independent of distance from the engine.
3 The difference between the MCM – Electric Motor Condition Monitoring and the motor supply current analysis (MCSA)
The detection of mechanical failure based on MCM monitor spectrum, It looks similar to thenalysis of motor current signature (MCSA), but several important differences to differentiate the typical MCSA.
The MCM monitor uses cause-effect relationships (voltage-current), while the MCSA uses only the current. Changes in input voltage will cause changes in the current that can lead to false alarms in MCSA. The cause-effect relationship in MCM processing helps protect against these false alarms.
 |
 |
| The motor current signature analysis (MCSA) | A monitor MCM – Electric Motors Condition Monitoring, uses cause-effect relationships (voltage-current), |
Figure 3 - The difference between the current signature analysis and the analysis MCM – Electric Motors Condition Monitoring
The anomalies detected in the electric motor are subjected to a sophisticated change persistence algorithm to protect against false alarms, making it less sensitive to random fluctuations MCM monitor the signals.
The MCM analysis is different from the MCSA. The MCSA involves spectral analysis of the observed current waveform (sometimes demodulated), MCM as the processing produces a power spectral density plot (PSD) from the waveform of residual current (the difference between the theoretical waveform and current waveform of the measured current).
4 Data acquisition in the MCM – Electric Motors Condition Monitoring
The voltage and current signals of the three phases (6 signals in total) They are sent to the monitor, where they are digitized for further signal processing. voltages below 480 V can be measured directly, while higher voltages require a transformer in the electric motor frame. Depending on the application, They are used current transformers or current sensors with Hall effect, to detect and reduce the motor current.
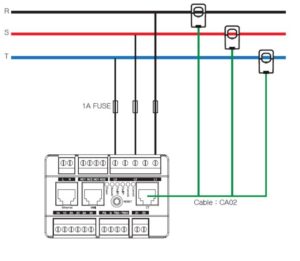
Figure 4 – Scheme MCM links – Electric Motors Condition Monitoring, for the analysis of electric motors
MCM operates in processing iteration cycles with a duration of 90 seconds. At the beginning of each 90 second iteration, the monitor collects samples of waveforms of voltage and current of the three phases V1, I1, V2, I2 e V3, I3. The rest of the period is used for post-processing and upgrading the front panel analysis.
5 Modeling and detection of faults
A monitor MCM – Electric Motors Condition Monitoring uses four different approaches to detection and analysis of failures of electric motors:
- One is based on the internal characteristics of the electric motor;
- Another is based on the frequency analysis of the residual current spectrum;
- A third analyzes the tensions and real currents of electric motor power to verify certain types of failures in the power supply and current;
- The fourth uses the data of a similar electric motors database, to provide an independent diagnostic reference.
5.1 The engine of the internal model in the MCM – Electric Motors Condition Monitoring
For optimal electric motor, The waveforms are sinusoidal voltage and current at the grid frequency. The mains voltage change creates magnetic forces which cause the rotor to rotate and the amplitude and phase of the motor currents are related to the input voltages through mechanical operation of the electric motor and the internal. We can think of the waveforms of the mains voltage as inputs to the electric motor and the actual waveforms as outputs.
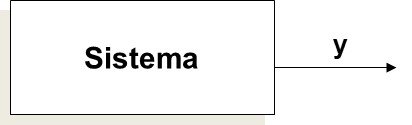
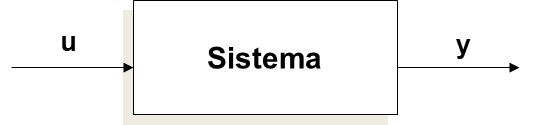
The electrical and mechanical parts inside the electric motor can be considered as a transfer function that converts the waveform of the input voltage waveform of the output current (Figure 5).
This is the key to understanding the internal engine model in MCM monitor – Engine Condition Monitoring.
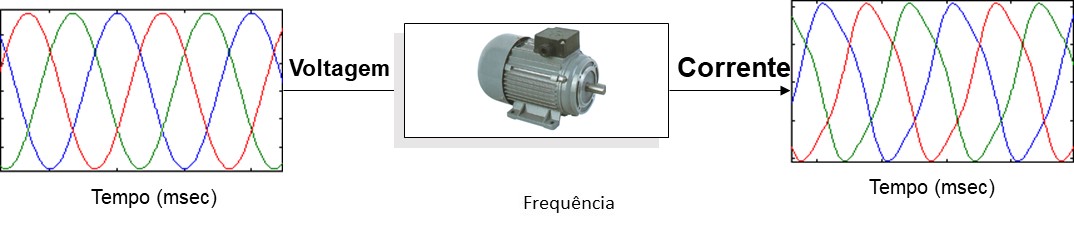
Figure 5: The electric motor as a transfer function. One way to supply voltage waveform is converted into a current waveform of the motor.
The monitor uses a linear model for the electrical and mechanical internal parts of the electric motor. This physics-based model is derived from a set of differential equations and may be expressed as a transfer function. During the learning process, the monitor determines the coefficients of this model. For a normal electric motor, the model transfer function is a great approach to the actual physical transfer of motor function.
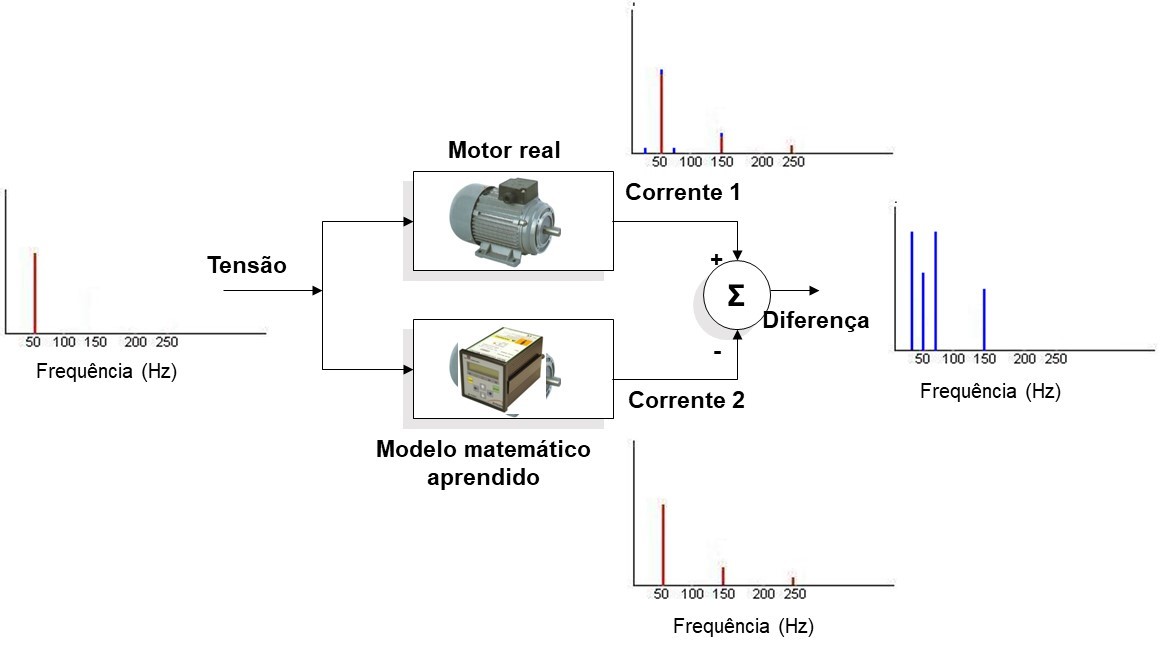
During monitoring, a monitor MCM – Electric Motors Condition Monitoring, measures the waveform of the input voltage and passes it to the model transfer function to obtain a waveform theoretical current. Meanwhile, the actual transfer function of engine converts the waveform of the input voltage in the observed current waveform (measure). The theoretical current waveform is subtracted from the waveform of the measured current to produce a waveform residual current (Figure 6). The residual waveform contains “deviations” between theory and reality, and the monitor uses this form of residual wave for analysis of mechanical failures.
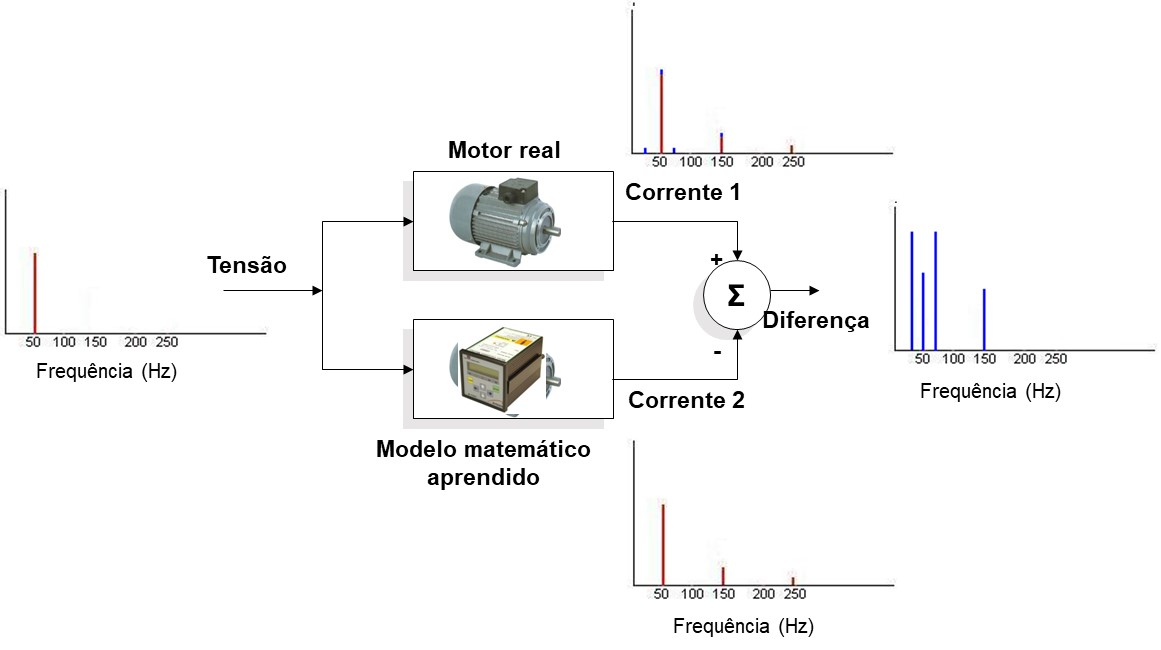
Figure 6: The shape of the supply voltage wave passes through the actual transfer function of motor, producing a waveform of current stream, with harmonic distortion, IMotor. The same waveform voltage is passed through the learned model transfer function, producing a waveform theoretical current, IModel. The two waveforms are subtracted, producing a waveform residual current. The residual wave form represents the deviation between theory and reality
Annex I and the reference 2) It is a mathematical description of the system.
5.2 Detection of electric motor failure modes in MCM – Electric Motors Condition Monitoring
Changes in internal characteristics of the electric motor (for example, a winding shorted) will cause the actual function of the electric motor is changed transfer. During monitoring, MCM obtains the drive voltage waveforms and current measurements and calculates a new set of coefficients observed for the internal motor model. The coefficients of the original model coefficients are subtracted from the observed residues to produce. These wastes are used to detect electric motor internal problems.
5.3 Detection of mechanical failures in the electric motor or driven machine
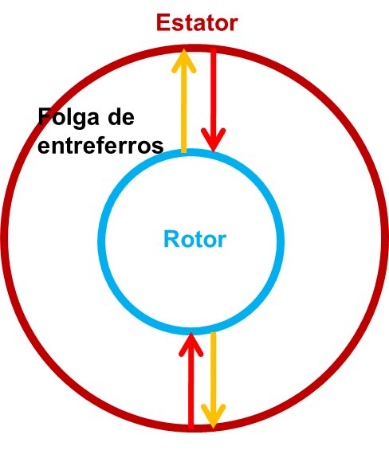
In an ideal electric motor, the rotor would be perfectly centered in the stator gap, would rotate smoothly and would not present imbalance. In real engines, the rotor is not perfectly centered in the stator, bearings and driven equipment and create forces vibrations and the rotor always has some imbalance.
The mechanical faults disturb the rotor position and create disturbances and distortions in the actual waveforms. As faults develop in machine assembly, cause the actual output current deviates further from the theoretical.
For example, an unbalanced rotor vibrate 1X RPM, causing a change in the gap of the rotor / stator in rotation. This change causes amplitude modulation of the actual signs and makes you appear side bands around the mains frequency, no PSD spectrum.
 |
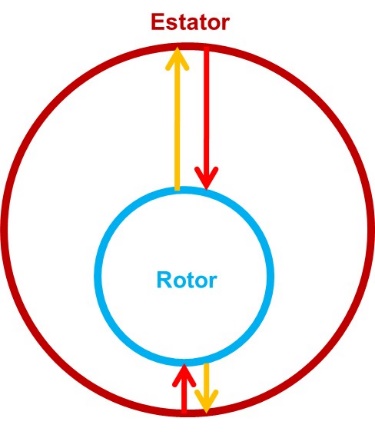 |
Figure 7: The forces / mechanical vibrations originating a variation in the gap between the motor irons
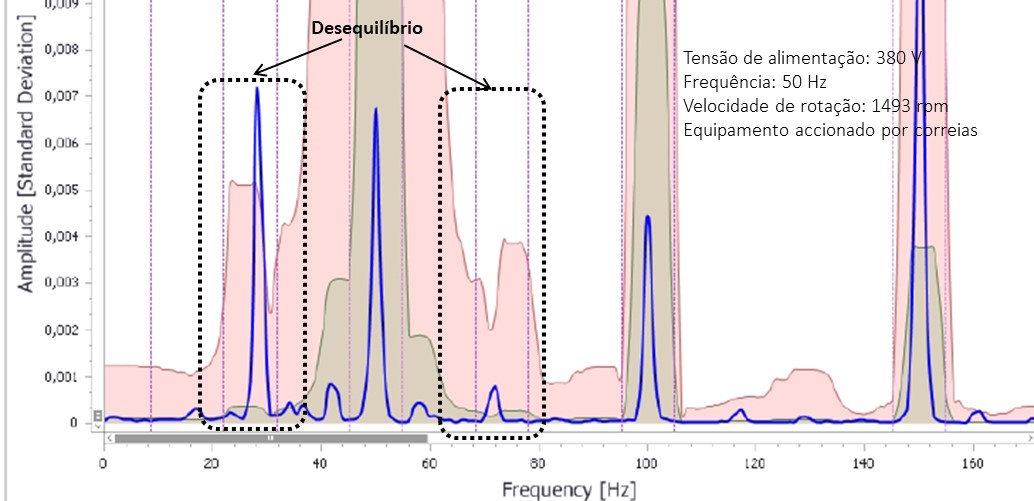
Figure 8 PSD will not do any spectrum of MCM – Electric Motors Condition Monitoring, motor imbalance manifests itself around the supply frequency ± 1 x rpm and multiple.
In another example, a failure in a bearing will cause a periodic disturbance in the rotor position; this disorder in rotor position will create a corresponding disturbance in the air gaps and gap-width modulation of the motor current. The modulation produces around the mains frequency sidebands in the spectrum residual current and the distance of the side bands of the network frequency corresponds to the bearing defect frequency.
Other types of failure can produce a wide variety of additional frequency content in real waveforms. The processing MCM – Electric Motors Condition Monitoring, demand that additional frequency content and uses it to diagnose different kinds of mechanical problems.
The waveform of the residual current MCM is based on a learned model, and, therefore, PSD is a spectrum of difference between theory and reality. Like this, the first MCM method detects changes in the motor current and then classifies the spectral characteristics of this change in fault classes. The monitor classifies the energy of the PSD spectrum in twelve typical spectral frequency bands associated with specific fault classes.
5.4 Fault current and power
During the learning period, a monitor MCM – Electric Motors Condition Monitoring, learns the typical behavior of this electric motor. Voltage or current deviations from normal behavior may signal a problem. The monitor checks significant changes in power factor, voltage and current imbalance. As an increase in the driven load will cause an increase in motor current, MCM methodology uses abnormal current as an indicator of a load problem. For example, decreasing the flow through a fan or blower would cause a decrease in load of the fan and motor current, and this could signal an obstruction in the flow.
6 The electric motor database
The monitor has a signal characteristic database of residual waveform, that they are representative of a large base of data of similar electric motors. This is used as a way to guard against missed alarms, if the MCM monitor is installed in an already faulty engine. When a measured value exceeds the value of the alert database, for this frequency band (Figure 8), a monitor disappear – assuming that the alarm level has been exceeded in the learning test.
7 The Learn
When first installed, the monitor learns the electric motor behavior to which it is connected. Spend some time to learn before starting to monitor the engine.
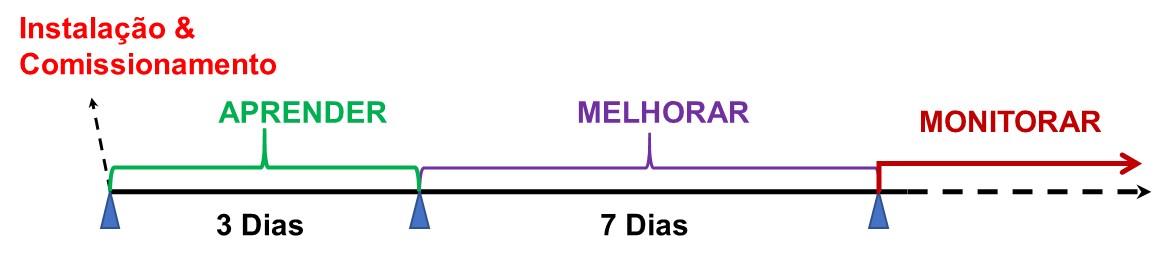
Figure 9 – To build the mathematical model of the electric motor which is connected, o MCM – Electric Motors Condition Monitoring, You need to complete the learning period. This period can take 7 a 10 days.
Some electric motors drive equipment operating at constant speed and load. This is the simplest mode to learn and monitor, because any change in the operating characteristics is probably indicative of a failure. Many machines operate at variable speed or variable load. In this case, which is normal for a range of loading, It may be abnormal for another. In this situation, the monitor learns and creates a separate internal motor model for each operating mode. After, as conditions change, it changes from one model to another.
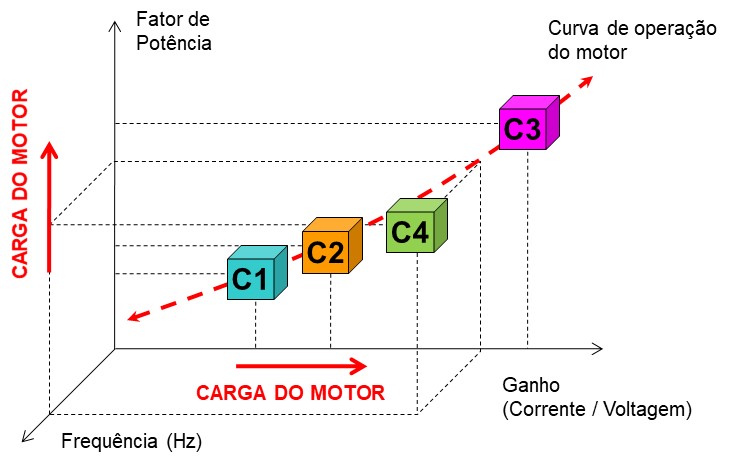
Figure 10 – During the learning period, o MCM – Electric Motors Condition Monitoring treats each engine operating point, as a group in three-dimensional space (power factor, gain, Feed rate). Each group has a separate model. In monitoring mode, each data is compared to the closest cluster. They can create up 600 groups.
The MCM learning period takes about 10 days (Figure 9), the electric motor is constant or variable speed. During learning, iterates the monitor collecting waveforms, performing analyzes and repeating the process. During each iteration 90 seconds, simultaneously collecting waveforms of voltage and current for each phase and, then, performs numerical analysis of data. During the initial phase of learning three days, MCM unit does not monitor. It is busy building a model of the internal primary motor and spectral statistics.
The period of learning has two stages.
- Stage of learning, in which the MCM classifies signals and performs no monitoring;
- Step improvement, in which the MCM starts monitoring and also updates the mathematical model (built during the first stage) with new data.
After the initial learning phase is completed, MCM unit – Electric Motors Condition Monitoring will start to monitor the engine. Meanwhile, continue to improve the model for another seven days (phase "Improve"). For variable speed motors, these iterations are scattered how many modes of operation are required. During phases Learn and Improve, The engine operation switch from one operating mode to another, the monitor will keep the previous data and start to learn the new operating mode. When the engine back to the partially completed so, the monitor will continue to learn from the last point.
Upon completion of the process of learning, the monitor stops the model refinement, and continuously monitors the motor using full internal model of the engine and the spectral characteristics of the PSD.
He, after completion of the model, the electric motor into a new mode of operation that has never been seen before, the monitor will go into alarm if the measured waveforms are significantly different from what was modeled. At this moment, the user can manually direct the MCM unit – Electric Motors Condition Monitoring, to learn the new way using the "Refresh". The MCM learn the new operating mode and will not monitor the new mode until the update learning process is completed.
Throughout the learning, if the power of the electric motor or MCM is interrupted, the monitor will automatically recover and continue to learn from the last point.
8 Detection of change, persistence and alarm
Because of noise and minor changes in the operational characteristics, there is always some variation between the model observed successively and spectrum parameters. During the learning phase, a monitor MCM – Electric Motors Condition Monitoring creates statistics describing the variation that occurs. When learning is completed, the monitor has a set of statistics for each model coefficient (electrical failures) and spectral band (mechanical failures).
The unit MCM – Motors Condition Monitoring operates by detecting differences between the observed parameters and previously learned; internal model coefficients or amplitudes of the spectral band. These differences must pass before a statistical test to be considered significantly different. These tests set alarm thresholds. The scan line alarms are generated based on the voltage unbalance voltage fluctuations and variations in the range found during the learning phase. A similar alarm method is used for power factor, Distortion Total Harmonic, effective values of voltage and current and voltage and current imbalance values.
Even in a normal machine can major deviations occur from time to time. To guard against false alarms, MCM processing – Electric Motors Condition monitoring requires that the change detected is persistent over time. The monitor uses a sophisticated algorithm that compares the amount by which a parameter exceeds the threshold value and the number of times it occurred in a time window. This sliding window varies depending on the amount in which the measured parameter exceeds the statistical threshold. The big limit exceedance require only a short time window, while the slight exceedance will require a long window. The monitor only trigger an alarm when the persistence requirement is met.
9 Diagnosis
A monitor MCM – Electric Motors Condition monitoring reports fault categories Figure 11) that function as signs and point to areas that should be investigated in more detail. It uses four independent methods of detecting faults covering two categories: electrical and mechanical.
9.1 Diagnosis of electrical faults
The electrical faults are associated with problems internal engine or external power problems. MCM unit monitors the two methods using two independent. The internal engine failures are detected using the internal model learned from the engine as a reference. During each monitoring iteration, the monitor calculates a set of eight internal motor model parameters based on current and voltage observed. These observed parameters are compared with parameters obtained during the learning phase and persistent and significant changes are detected and reported as electrical failures. These failures include the following examples:
-
- loose windings
- stator problem
- Short circuit
The external power is directly verified as a voltage or current imbalance, voltage range, Maximum current and low voltage or current.
9.2 Diagnosis of mechanical problems with the MCM – Electric Motors Condition Monitoring
The categories of mechanical failures are detected and diagnosed using the PSD spectrum of the waveform of the residual current. The residual current is the current difference between the observed and theoretical current produced by the internal motor model using the same voltage observed. The PSD spectrum is divided into twelve frequency bands that are normally associated with certain mechanical problems (listings to follow). The analysis of these frequency bands produces failures classes for further investigation.
-
- loose Foundation / components
- Imbalance / misalignment / coupling / bearing
- Correia / transmission element / driven equipment
- Bearing
- Rotor
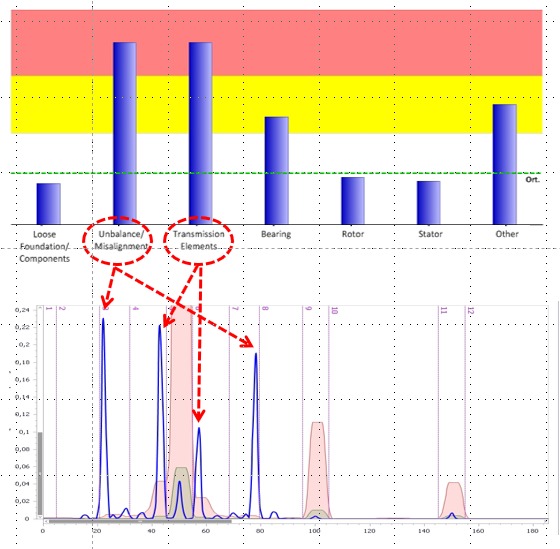
Figure 11 - The diagnosis of mechanical damage to the PSD spectrum of MCM – Electric Motors Condition Monitoring
It should be noted that the load check alarm, caused by abnormally high or low current, It is usually caused by a change in the load of the driven machine. The load machine can change for two reasons: failure or process change. If the machine is running in a different condition that is not seen during the learning period, the user must configure the MCM unit to update the way to learn this new condition. If the load is changed due to a failure, the problem should be investigated and you need to ensure that the alarm is cleared on the monitor.
The engine database provides an independent analysis in case the MCM unit learn a faulty system. The database engine is at normal and high values for each of the twelve tracks PSD spectrum based on experience with a large number of similar engines. If a residual value of PSD spectrum band exceeds the high value of the database, after persistent verification, Monitor will warn you that something is wrong.
10 Parameterization of alert and alarm levels
warning and alarm levels are set automatically by the system after introducing the motor characteristics system, namely:
- Tension;
- Amperage;
- Rotation speed;
- Etc.
The system does not require the intervention of specialists to define these values.
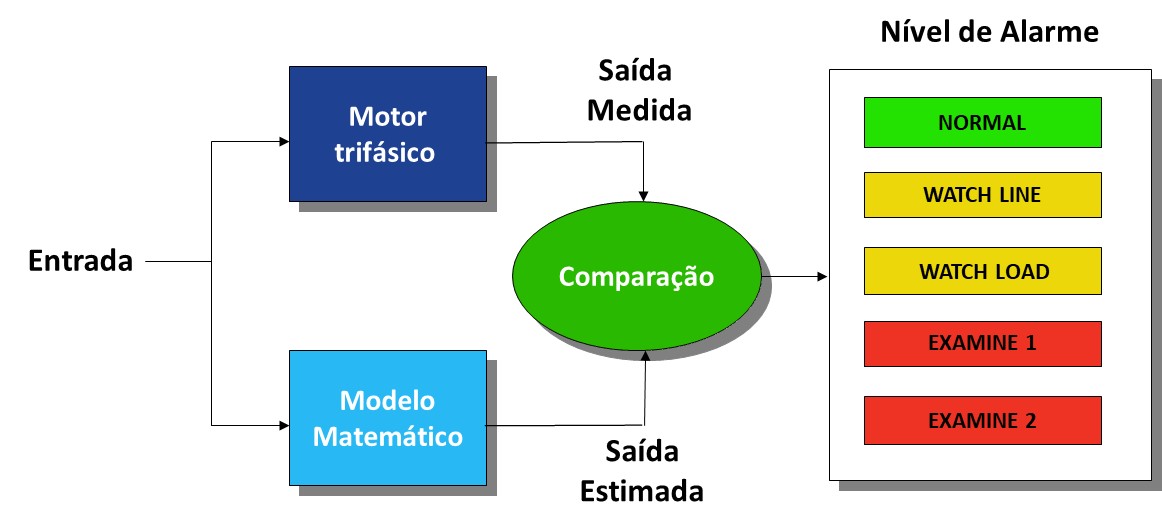
Figure 12 - alarm and alert levels are set automatically by the analysis system MCM electric motors – Electric Motors Condition Monitoring
11 The report
The report is issued automatically by the system, without the need for interpretation of an expert.
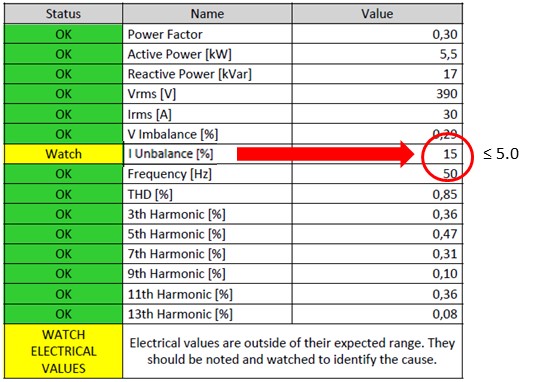
Figure 13 - Stratus MCMMCM report – Electric Motors Condition Monitoring, with electrical anomaly indication
12 Limitations of MCM – Electric Motors Condition Monitoring
The MCM is a powerful monitoring system of electric motors. However, there are some limitations in their use and interpretation.
- It can not be used for dc motors or single-phase.
- For variable frequency drives, the inverter cutoff frequency should be more than 2 kHz.
- MCM unit can not be used in engines with voltage or power rapidly varying. The load / speed can not always be to vary very quickly due to the need for a learning time, for each load condition.
Mechanical diagnoses are based on energy in twelve spectral frequency bands. This is, by nature, an approximate analysis and diagnostic indications usually represent only broad classes of problems. As is normal in permanent monitoragem systems, the user will need to implement additional inspections to confirm and determine the actual failure.
The unit MCM – Electric Motors Condition monitoring can not be used in engines with voltage or power rapidly changing. The voltage, the frequency and amplitude of the current should not change over 15% in six seconds. This is not a serious constraint for most applications, but some applications, as crushers, They do not respond to this requirement. If there is a sudden load change, the monitor will reject this sample; However, the same machine might work constantly with some charge, and this would allow the unit to monitor the machine.
The unit MCM – Electric Motors Condition Monitoring works well in applications where the motor is located some distance from the current transformers or potential. However, the power used in the measurement point must be dedicated to a single motor. On the other hand, one transformer stations set can be used to all motors which are supplied from the same voltage source. The current measurement constraint is a consideration for underwater applications where power can be supplied to the seabed only to branch out to multiple engines. In this case, MCM unit can not be used in the main power. However, It could be used if the current transformers could be installed in each branch.
13 Conclusion
O MCM – Electric Motors Condition Monitoring is a powerful monitoring system and analysis of electric motors. Their power comes sophisticated processing algorithms and analysis of signals and redundancy built. Their ability to learn makes it sensitive and flexible and electric motors database protects against lost alarms caused by learning an already faulty engine. The alarm is intelligent and uses statistical analysis combined with an adaptive persistence test. These features produce a product that is a significant improvement over the current signature analysis of conventional engine and has a proven track record documented by many practical cases.
The DMC as well as providing the MCM service – Electric Motors Condition Monitoring also provides these permanent monitoring systems.
On this link you can find catalogs of this equipment
Annex I - Rationale for the mathematical modeling of the MCM – Electric Motors Condition Monitoring
A nonlinear system is described by the following equations (eq.1):
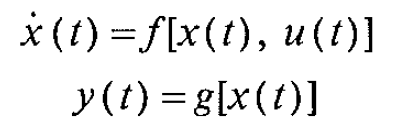
Linearizing these equations on a nominal operating condition and income discretizadores (eq. 2):
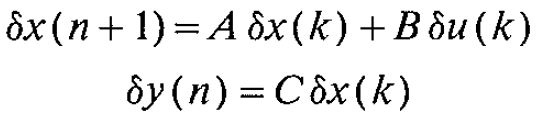
They may be placed in canonical form alpha (eq.3):
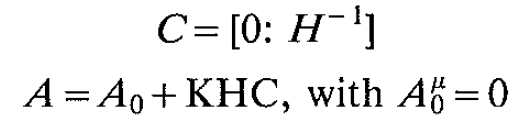
The expression for the state dx(k), no time k, this system is given as (eq.4):
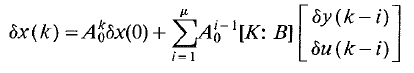
Using nilpotência of A0 , the above equation is given as (eq.5):
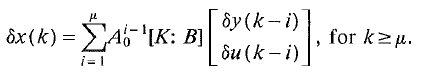
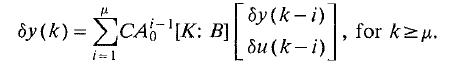
Multiplying both sides by the matrix C, this equation can be expressed in terms of measured input and output variables (eq.6):
The System Identification and detection of faults is performed as follows:
Estimation of structure; the line by line search observability matrix is used to obtain levels of observability;
- Parameter estimation; It is used the technique of least squares;
- The detection and fault diagnosis uses three criteria in parallel:
- residual errors
- Parameter variations
- Spectral analysis of residual
References
- Fault diagnosis for the Space Shuttle main engine, Ahmet Sensing; Journal of Guidance Control and Dynamics 15(2) · May 1992
- Implementation of a Model Based Fault Detection and Diagnosis for Actuation Faults of the Space Shuttle Main Engine, A. Hears, T.-H. Guo, W. Merrill and J. Musgrave,1991,Third Annual Conference on Health Monitoring for Space Propulsion Systems,
- A distributed fault-detection and diagnosis system using on-line parameter estimation, Hear et al., 1991, NASA Technical Reports Server (NTRS) 19910016382
- Identification of Discrete Time Multivariable Systems: A Parametrization via a – Canonical Form, Elder and I hear that, Automatic, Volume 29, Issue 4, July 1993, Pages 1127-1131