History of vibration measurement in predictive maintenance
History of vibration measurement in predictive maintenance
1 – History of vibration measurement – 100 years of predictive maintenance with vibration measurement
This article briefly describes the history of measuring vibrations in predictive maintenance, that seventeen years from now, in 2039, it's been a hundred years.
There has been a perception for a long time that the vibration level is an indicator of machine operation.
In an article on vibrations in 1939 referred:
Instruments for measuring vibrations are fairly common.. They are generally of the seismometer type and are normally applied to bearings..
It is part of the general culture of those interested in the area to know a little about the history of analysis vibrações.
2 – History of vibration measurement – The prehistory of vibration measurement
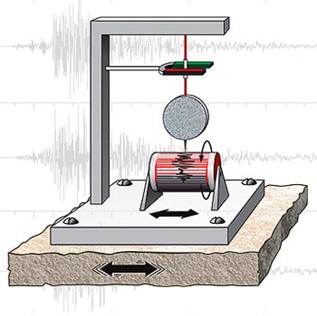
The first type of motion detectors that there is memory, are earthquake detectors invented in China.
The first known seismograph was invented in China by Zhang Heng in 132. This apparatus consisted of eight bronze spheres, each held by the mouth dragon statues. When an earthquake occurred, no matter how small, the dragon's mouth opened and the ball fell into the open mouth of one of the eight metal frogs below.. The device made it possible to determine, thus, the direction of propagation of the earthquake.

In the 19th century, seismometers appeared.. The generation of the seismogram was done in an analogical way from a pen or other object connected to a mass, marking movement on a roll of paper.
The first vibration sensor with an electrical signal output was based on strain gauges and appeared in the years 20 20th century. (Source: B. McCullom and O.S. Peters, A new electric telemeter, Technology Papers National Bureau of Standards 17(247) (January 4, 1924).
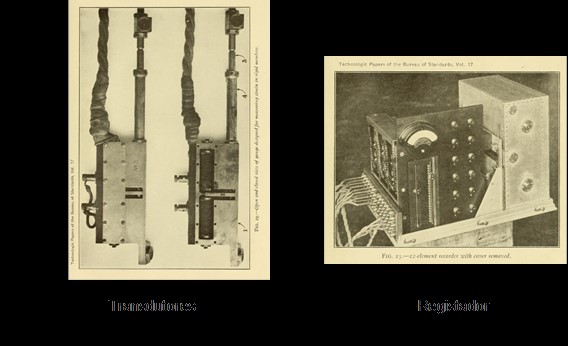
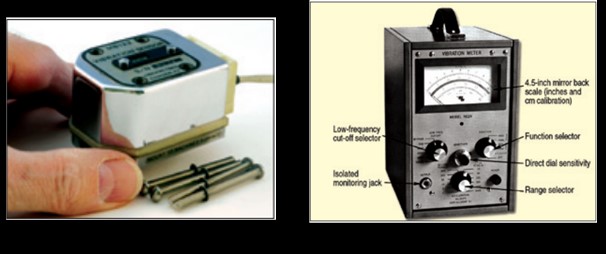
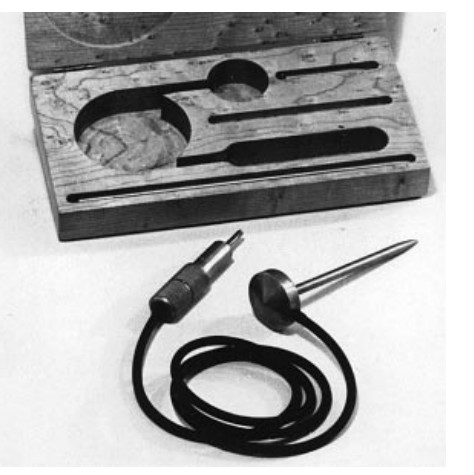
Posteriorly, to respond to the need to measure vibrations with frequencies above 200 Hz, in machines, Electrodynamic velocity vibration sensors appeared (years 30 20th century).
To follow, you can see a sensor of this type and a vibrometer, extensively used in the US industry over the years 40 20th century.
3 – History of vibration measurement – 1939 – Year zero of predictive maintenance with vibration measurement – the Rathbone curves
In an article that marks the beginning of the history of predictive maintenance, for the first time vibration limits on machines are indicated. T.C. Rathbone at the time was Chief Engineer, in the Turbines and Machinery Division, para a Fidelity and Casualty Company of New York.
The article, entitled "Vibration Tolerance” and published in Power Plant Engineering (1939-11: Vol 43 Iss 11), provided a guide for evaluating conditions based on vibration displacement of approx. 60 cpm (1 Hz) a 7.200 cpm (120 Hz).
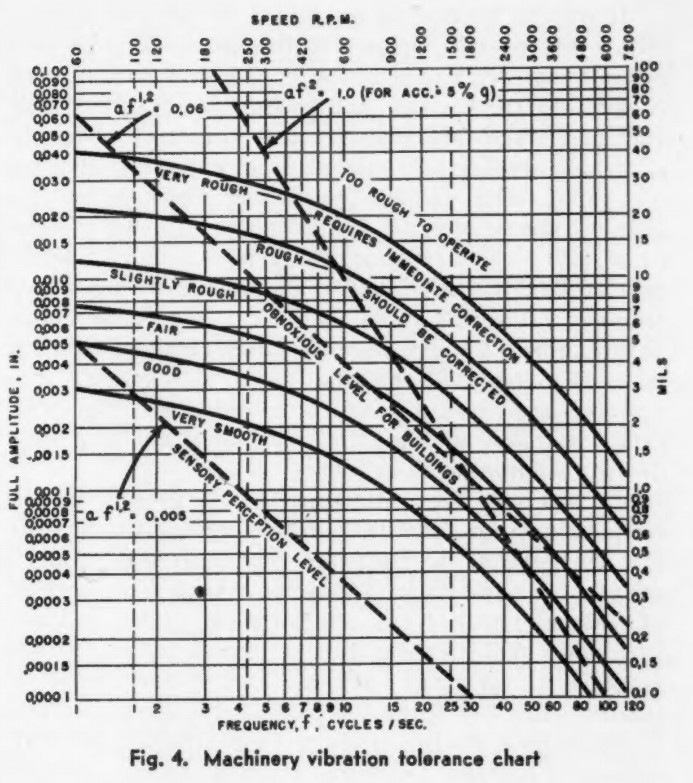
Rathbone's article introduced a number of profound ideas, including a set of severity curves, of amplitude versus frequency, approximately constant vibration speed, around the rotational speeds of typical steam turbo generators. The Rathbone severity criteria are based on experience and represent the first known method of relating vibration amplitude to operating condition – and, by implication, service life and risk of failure. It is incredible to recognize that the concepts and criteria of severity developed by T. C. Rathbone continue to be suitable; more than eighty years later!
4 – 1943 – The first piezoelectric accelerometer
You piezoeletric accelerometers later appeared, in the years 40 20th century.
accelerometer type 4301 da Bruel & Kjaer (1943)
The sensor was made of Rochelle salt crystals and had a sensitivity of 35 a 50 mV/g and a resonant frequency of 2 a 3 kHz.
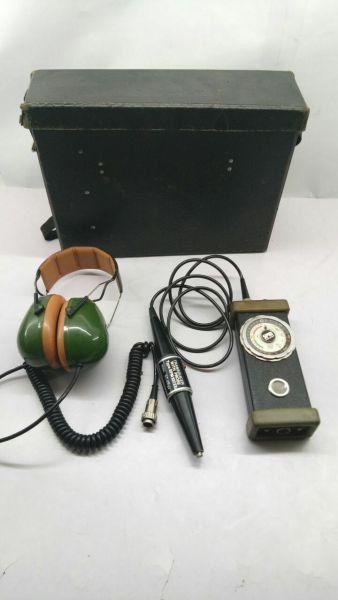
5 – 1952 – The speed sensors – the first with electrical output used in predictive maintenance
Much of the initial vibration measurement was performed with mechanical devices.; or finger (reliable and highly calibrated indicator), screwdrivers and a coin; all were used a lot. in the thirties, the appeared the moving coil electromechanical speed transducer (the IRD introduced the Model 544 in 1952-53). The speed transducer was reasonably robust and, more important, it was self-generating with a low impedance output that was easy to use. With electromechanical speed pickup, vibration amplitude can be measured with a voltmeter.
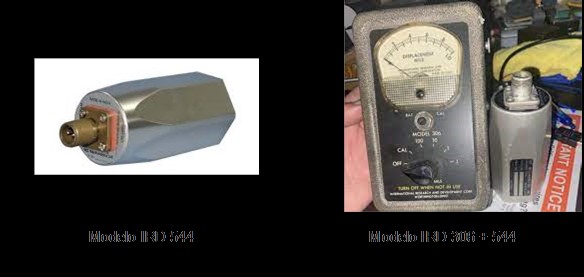
IRD Model 544 + IRD Model 306 + 544
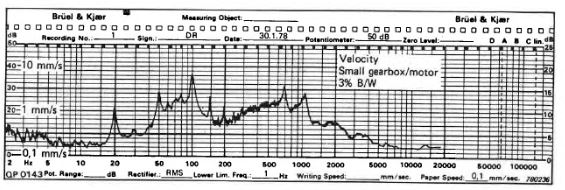
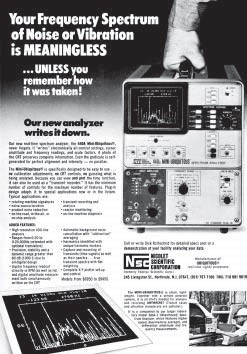
6 – History of vibration measurement – 1950 – Frequency analysis (analog)
As technicians gained experience, There has been a growing recognition that, although the amplitude was a good and intuitive measure of the severity (the stronger, worst!), the frequency content indicated the type of defect present. Full exploration of this theory has been limited by vibration analysis instrumentation., that was very primitive by today's standards.
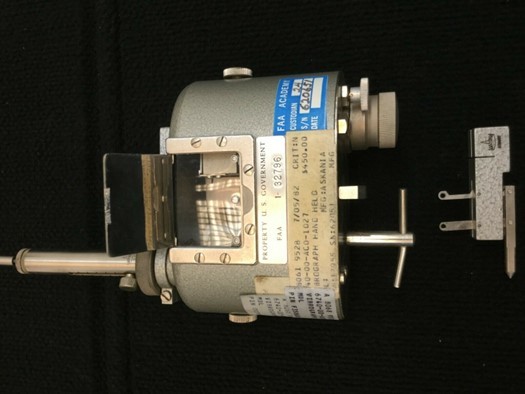
The oldest signal analyzer, the Mechanical Manual Vibrograph shown in the following figure, traced a vibration displacement waveform, in the time domain, on paper.
a skilled user, with a lot of imagination, could tell if the main excitation was at the rotation frequency, if other frequencies were present – and little else.
The current era of vibration analysis probably began in 1950, when Art Crawford, then graduate student, took on the challenge of finding a way to reliably balance high speed spindles. The result, under the IRD (International Research & Development), founded in 1952, who has become the leader in dynamic balancing, Frequency analysis and evaluation of the working condition of machines for many years.
Analyzers with manually tuned filters appeared.. These provided the basis for the amplitude and frequency patterns that we now associate with common problems., as an imbalance, misalignment and loosening.
Laboratory instruments with the greatest ability to measure and display vibration signals were bulky and cumbersome to use., with a fraction of the capacity taken for granted in today's portable data collectors.
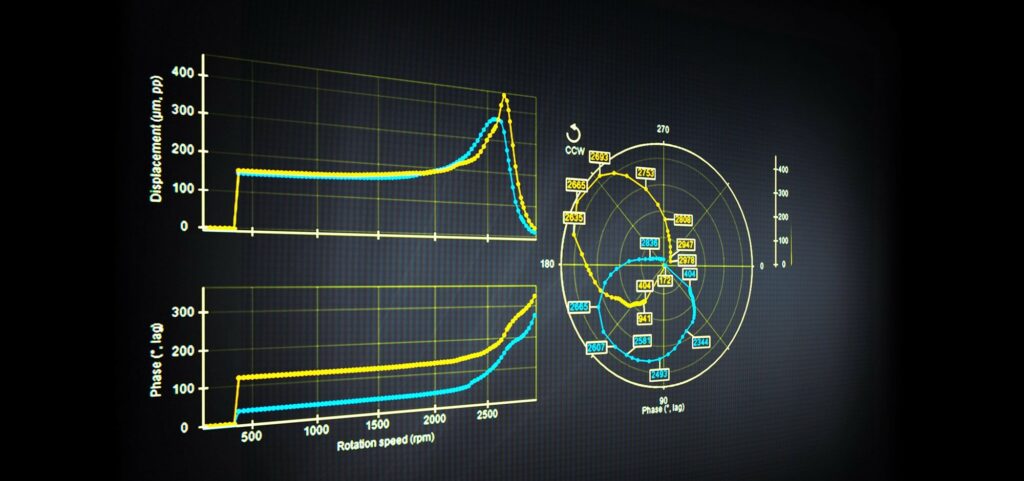
7 – 1965 – You proximitors and permanent monitoring of turbomachinery
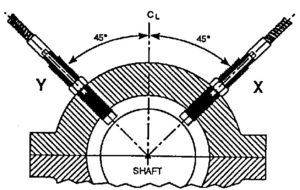
Bently Nevada was the first to successfully apply eddy current technology for use in contactless displacement sensors. This type of electronic sensor is typically used to measure very small distances between the sensor tip and a conductive surface., like a rotating shaft. Measured displacements are extremely small, normally only a few microns.
At the beginning of the decade 1960, industrial users of turbomachinery have started to experiment with these sensors for measuring vibration. Direct observation of the vibratory motion of a machine shaft is desirable because, mostly, the shaft is the source of vibration in the machine. Before the introduction of proximitors, this shaft movement had to be indirectly inferred by measuring the vibration in the machine housing.. While machine frame measurements can be valuable under certain conditions, Machines that employ fluid bearings often have damping and rigidity characteristics that do not adequately transmit shaft vibration to the machine housing. Consequently, direct observation of the machine shaft (rotor) has been recognized as a more accurate method of assessing the condition of these machines.
Bently Nevada has introduced the series of monitoring systems 5000, in 1965, that was produced until 1998.

In 1970, the American Petroleum Institute defined the proximity probe as the measuring device for measuring acceptable shaft vibration, during factory acceptance tests. This was added as a requirement in their standard for centrifugal compressors.. Bently's pioneering design for shaft vibration measurement, using proximity probes, has become the industry standard for turbomachinery acceptance testing and machine protection. The eddy current proximity probe has become the preferred method for assessing vibration and general mechanical condition in big turbomachines that employ oil film bearings. Such machines and types of bearings are responsible for the vast majority of compressors., turbines, bombs, electric motors, generators and other rotating equipment greater than 1.000 HP, and can be found in abundance..
8 – 1968 – Sohre's tables
An important milestone occurred in 1968, when John Sohre, a major contributor to machine design and analysis, publicou “Operating Problems with High Speed Turbomachinery, Causes and Corrections” na Conferência ASME Petroleum Mechanical Engineering. The article included the famous “Sohre tables” that describe the vibration symptoms of turbomachinery problems., along with probable causes in exhaustive detail. The article and graphics have been republished multiple times in multiple languages and, conceptually, form the basis of much of today's detailed diagnostic technology.
9 – 1971 – The ICP accelerometer
As already mentioned, piezoelectric accelerometers existed since the 40 20th century. However, in order to work, they needed expensive charge amplifiers., separate.
PCB was the company that most contributed to the acceptance of the integrated circuit technology (ICP) in piezoelectric transducers. PCB has put ICP technology for the first time in a high-speed shock accelerometer. 100.000 g em 1971. The first ICP industrial accelerometer (Model 308A04) was developed in 1973.
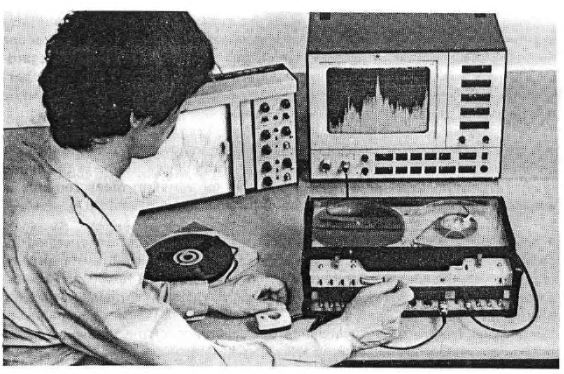
10 – 1975 – Frequency analysis with a portable FFT analyzer
In 1965, Cooley and Tukey of Princeton University published their landmark paper on the calculation of the Fast Fourier Transform (FFT). This development allowed an FFT transform of 1024 spots (512 lines) processed in one-hundredth of the time previously required. demanded 50% less memory, to complete the calculation
A Time Data, a California company, designed the first commercially available FFT system in 1967. Your model system 100, which was housed in two racks of 6 foot, set the stage for the FFT analyzers that are available today. He processed a transform of 1024 points in 1 second.

Model Control Panel 100
In 1975 Nicolet rocked the market with the first truly portable single-channel FFT analyzer (13,5 Kg). The 440A Mini Ubiquitous® had 400 lines, with built-in screen. For a period of approximately seven years, Nicolet provided 30 a 45 analyzers per month.
11 – 1980 A bearing failure detection – o SPM
The history of SPM began in the 1990s. 1960. AP Moller, a danish shipowner, discovered from bitter experience that the cargo pumps of his tankers were breaking down very often without warning.. An inventor and an enterprising financier decided to do something about it..
In 1969, Eivind Søhoel, o inventor, patented shock pulse method that identifies weak shock pulses from bearings. In 1970 the company SPM was formed. After just a few years, developed the first rules for evaluating signals from measurements. In the years 80 SPM has installed millions of measuring points and sold 40.000 portable measuring instrument units 43A – a true classic.
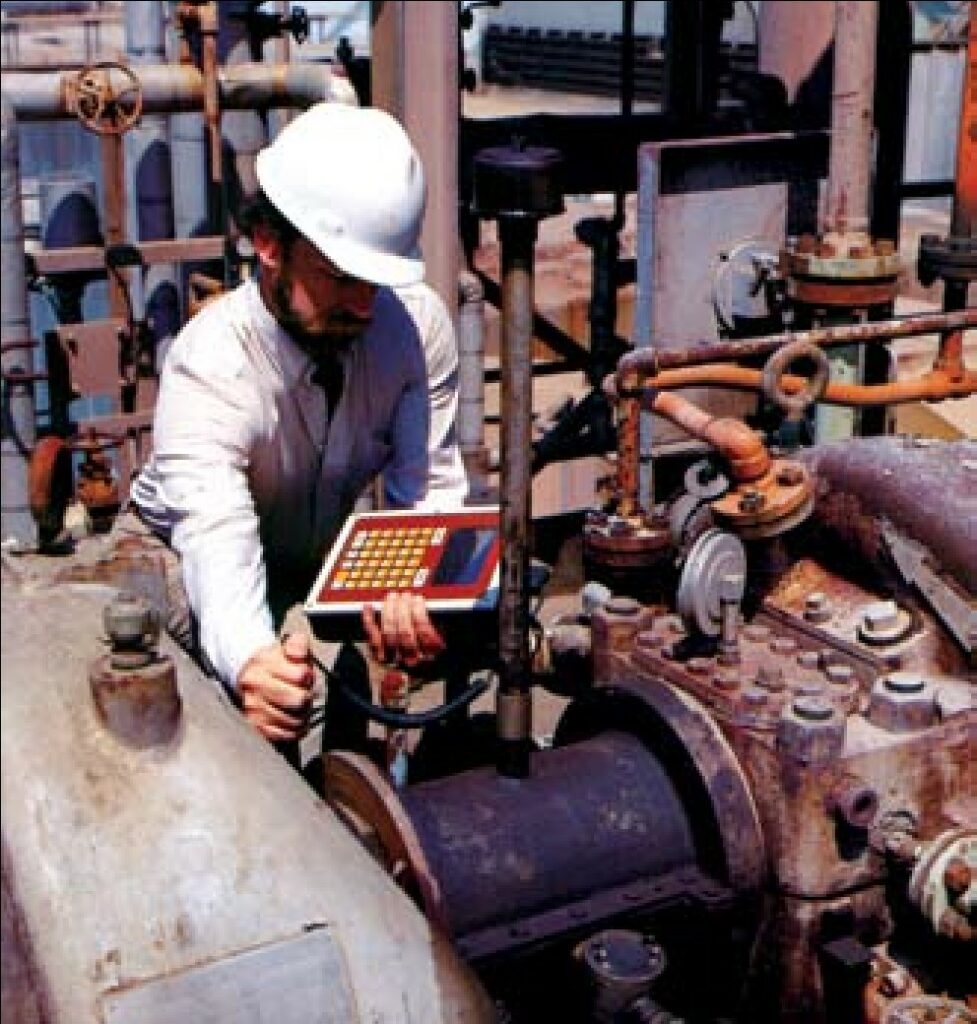
12 – 1982 – The first data collector
The first commercial instrument of this type was the AVM-1, introduced by Tecalamet Electronics, not uk, around 1982. The AVM-1 used an acceleration sensor, recorded vibration levels in octave bands and stored the results in internal memory, that could be transferred to a computer for trend analysis.
In 1984, Palomar Technology International introduced the first handheld data collector with an internal high resolution FFT analyzer, medium and large screen with FFT spectrum.
The screen was quickly updated to include a moving cursor, frequency and amplitude indication at the cursor position and, eventually, all the features of a lab FFT analyzer, including zoom and waveform display. This is the basic design that has been constantly expanded and substantially improved by Computational Systems., Inc. (CSI), now part of Emerson Process Management; Diagnostic Instruments (now part of SKF), SKF Condition Monitoring, DLI Engineering Corp., (Azima DLI Corporation), ADASH and others.
Combined with condition monitoring software on PC, The portable data collector has opened up a whole new era of machine condition assessment. For the first time, Complex vibration characteristics could be collected easily, subjected to detailed analysis and comparisons, minimizing manual efforts.
At the beginning of the decade 1990, the technology of data collector advanced, to the point of practically replacing the laboratory FFT, in all machine analysis tasks, except the most complex.
13 – Years 90 of the 20th century – the integration of technologies
In the mid-1990s 1990, it became evident that condition control technology with vibration measurement was much more effective when combined with complementary ones.. These included particles in the lubricating oil and chemical analysis, motor current analysis, thermography, flow analysis, ultra-sons, operational performance and efficiency.
Chemical analysis of lubricating oil has been available since the 1990s. 1950. Particle monitoring with ferrography, originally developed by Foxboro Corporation, been available since the mid-1990s. 1970. Both were treated as separate technologies and rarely combined with vibration to form a more complete picture of the condition.. From the end of the decade 1990, condition monitoring software began to incorporate vibration data, fluid analysis and other condition characterization data.
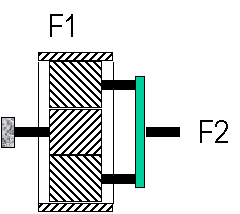
The motor current analysis, used a current sensor and FFT zoom to monitor the amplitude of the slip frequency sidebands around the mains frequency to identify rotor problems of asynchronous motors.
The best predictive maintenance programs of today, integrate all technologies and measurements from online and offline sources.
14 – History of vibration measurement – 2003 – The certification of vibration analysts
Was 2003 that ISO published the first version of the standard with requirements for the training and certification of people:
ISO 18436-2:2003 – Condition monitoring and diagnostics of machines — Requirements for training and certification of personnel — Part 2: Vibration condition monitoring and diagnostics
At the moment this certification has become a very common requirement and it can be said that it has revolutionized training in vibration analysis in predictive maintenance.
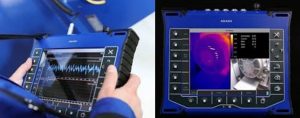
15 – 2019 – The integration of thermography in a vibration data collector
In 2019 ADASH took the next step: integrated a thermography camera into a vibration analyzer laptop, O VA5Pro.

16 – History of vibration measurement – 2022 – Present and future
In our day to day, current trends are visible:
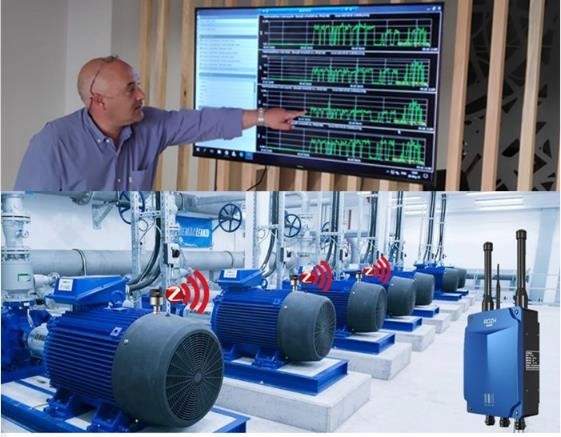
digitization
Undoubtedly the permanent monitoring, has an increasingly important place in condition control with vibrations. On the other hand, the new web and app interfaces are transforming the interaction between technicians and machine information.
Artificial intelligence
A Artificial intelligence, for now, offers much less than its sellers claim.
Only on the simplest machines do their diagnoses have any reliability. However, we are still at the stage where, who trust your recommendations without carrying out a check, or, probably, have a bad experience.
It's not clear how AI will diagnose a loose stud or a break in an oil pipe. In other words, the time when vibration analysis diagnostic specialists were out of work, it did not arrive yet.
However, it is to be expected, that the quality and reliability of the recommendations made by AI improve and assume more and more relevance.
Sistemas wireless
You sistemas wireless, as they are more economical, gives a strong impetus to digitalization.