Measurement of vibration
The following are the basic concepts of vibration measurement.
1 The vibrations are indicative of the operating conditions of the machines
An ideal non-rotating machine produce vibrations. The absence of imbalances, desalinhamentos, days off, etc., would not exist causes for the vibrations happening. In practice this does not happen, then the vibrations appear.
The vibrations are relevant in many ways; may cause noise, discomfort, breakdowns etc..
A well-conceived design will result in a machine with normally very low vibration and noise levels.. However throughout the machine life, the clamping bolts loose, components deform, increase the clearances, not to mention in misalignments, imbalances, etc. All these factors will contribute to an increase in vibrations that can cause resonances and increase the load on the bearings.. In turn vibrations accelerate the degradation processes of machine components for directing, so that a malfunction.
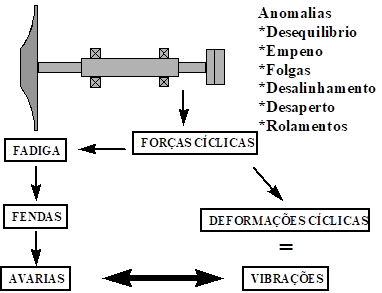
While the forces generated in operation machines are more or less constant, vibration levels will also remain substantially constant. Furthermore, on most machines, the vibration level has a normal value, and when the machine is in good condition, its Frequency Spectrum has a characteristic appearance. The Frequency Spectrum, obtained when the machine is in good working condition, It is so often called “signature” of the machine, and it is obtained through frequency analysis of vibrations in.
When defects are beginning to develop, the vibrations begin to rise and increases the amplitude of certain spectral components.
Thus, the vibration measurement is widely used for maintenance. But also in the development of a machine, in their manufacture and quality control often uses the measurement and analysis of vibration.
Units
The basic units used to describe vibration forces and motions, are in the International System of Units (AND).
| International system | Sistema Imperial | |
| displacement | the calculation is a little more complicated –peak to peak (1 micron = 0,001 mm) | mils-pico a pico (1000 mils – 1 inch) |
| velocity | mm/s peak or rms | in/s peak or rms IPS peak or rms |
| Acceleration | g, peak or rms (9,81 m/s2 = 1g) | g (9,8 m/s2) , peak or rms 386,1 pol / s2 = 1g |
Cause and effect – Nature of Vibration
Machines and structures vibrate in response to one or more pulsating forces, often called excitement. As examples we include the mass imbalance and the misalignment. The process is cause and effect. .
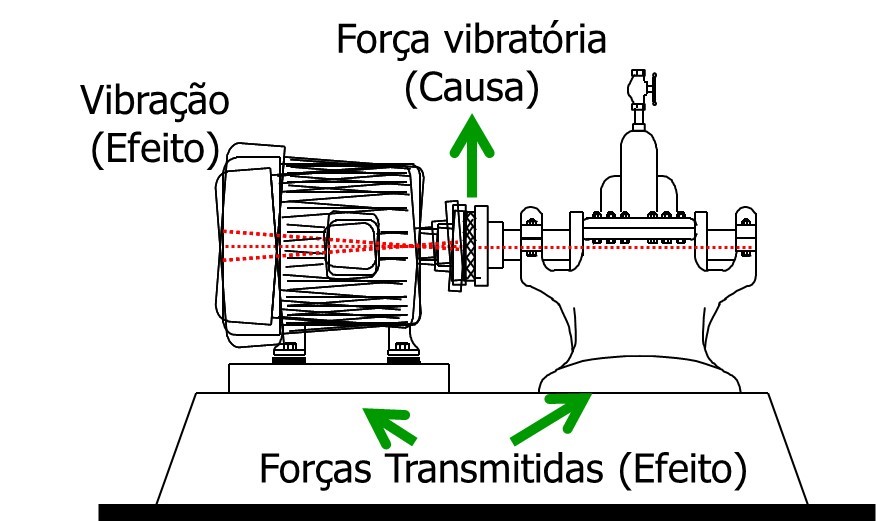
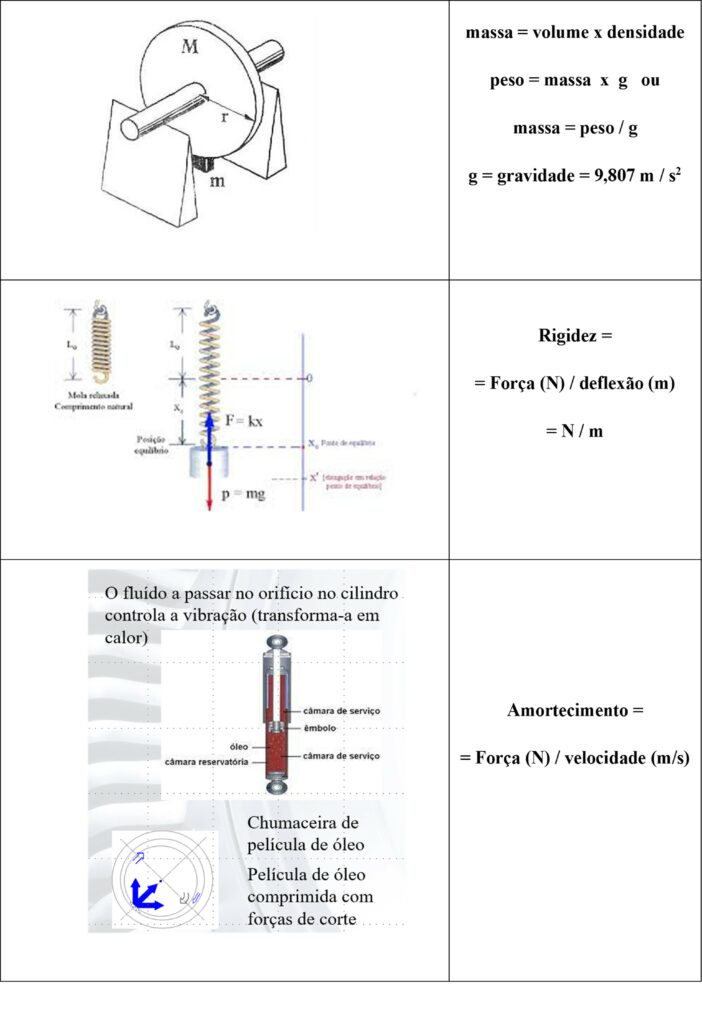
The amplitude of vibration is dependent not only on the force but also on the properties of the system., both can depend on the speed. these are the mass (kilograms), rigidity (Newton/m), and damping (Newton's/m).
2 Measurement of vibration – characterization of a periodic vibration
2.1 . The vibrations that are
It is said that a body is to vibrate when describing an oscillating motion relative to a point.
There are basically three types of vibrations:
- random
- transients
- periodic
2.2 Movement the vibrations
Three fundamental characteristics of vibration are frequency/period, amplitude and phase.
Period
O period is obtained from the time waveform; is the inverse of the frequency. The period is defined as the time required to complete one cycle of vibration..
A movement that repeats itself at equal intervals of time, it is called periodical . The sinusoid in the figure below has a period T .
Period is measured in seconds or milliseconds [1000 milliseconds (ms) it's the same as 1 second (1s); to convert milliseconds to seconds, move the decimal point three decimal places to the left or divide by 1 000].
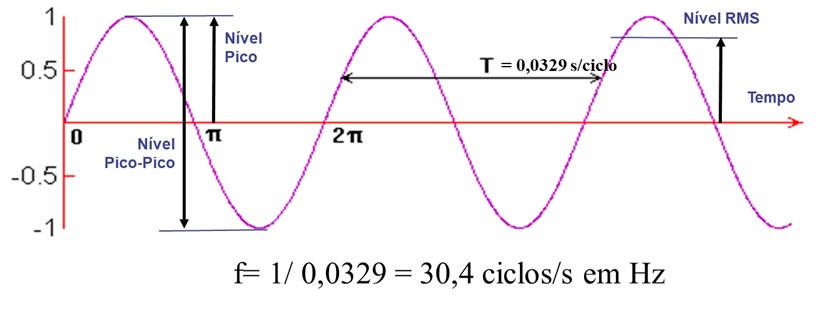
T – period (seconds)
Frequency = inverse of period = 1/T (Hertz) – The frequencies are expressed in Hertz (Hz), which is one cycle/second, or also in cycles / minute (CPM), or rotation speed orders.
1 Hertz= 60 CPM
• The spindle rotation speed is expressed in revolutions per minute (RPM).
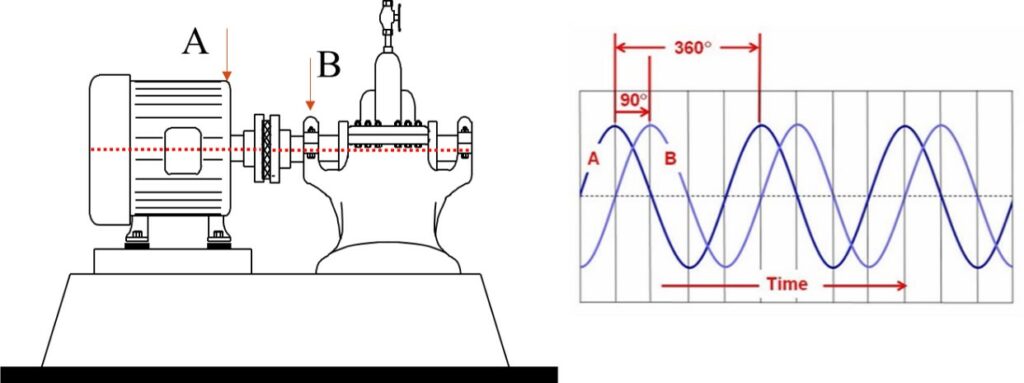
•The phase is expressed in degrees (degrees), where one shaft rotation or one period of vibration is 360 °.
Frequency
The frequency f is equal to the inverse of the period., i.e. 1/T.
A Frequency is defined as the number of cycles or events per unit time. It is expressed in:
- cycles per second (Hertz, or Hz),
- cycles per minute (CPM),
- operating speed orders if vibration is induced by a force at rotational speed.
The running speed of a machine, as well as critical speeds, are expressed in revolutions per minute (RPM).
The most basic form of periodic motion is sinusoidal motion. (often called harmonic motion), which is represented by a single sinusoidal waveform. Some vibration movements in machines are harmonic, an example is the vibration of a machine due to mass imbalance, which occurs at operating speed. However, most machines have multi-frequency components in their complex vibration patterns that result in non-harmonics, more periodic waveform.
Harmonics have a frequency that is an integer multiple (for example, 1, 2, 3, 4, etc.) of any sinusoidal vibration.
Orders are integer multiples of sinusoidal vibration at the frequency of machine running speed.
The number of cycles completed in a unit of time is the vibration frequency. (the inverse of the period).
- T= period, seconds / cycle
- f = 1 / T, cycles / second (CPS)
- N = 60 f, cycles / minute (CPM)
A vibration with a period of 11,899 ms (0,0119 s) can be converted into a frequency (84,04 Hz or 5042 CPM) using the equation for the frequency f = 1 /T .
Phase
A Phase is the time relation, measure in degrees, between vibrations of the same frequency.
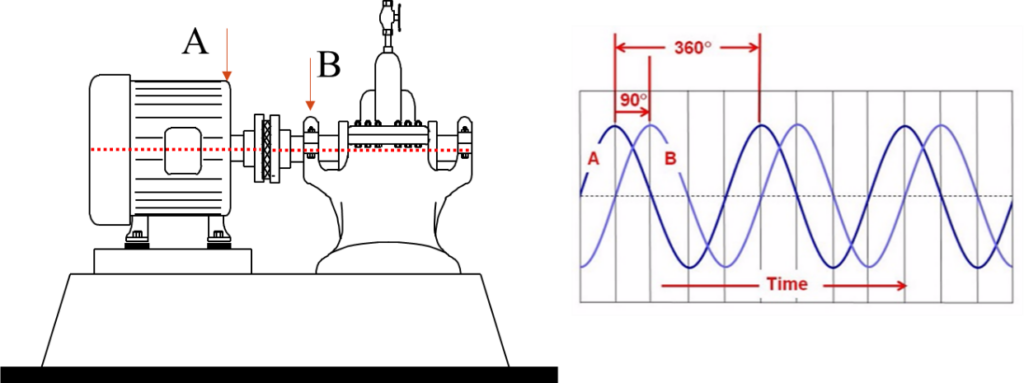
From the previous figure it can be seen that the vibration peak measured at point B occurs in time after the vibration peak measured at point A.. The vibration at point A is said to lead to the vibration at point B.. Phase can be used to determine the time relationship between excitation (strength) and the vibration caused; for example, the force due to mass imbalance and the vibration it causes. This phase is used for equilibragem.
amplitude of vibration
A Amplitude is the maximum vibration value at a given location on the machine.
Amplitude is the level of vibration in a sample of data..
- Peak Amplitude is the largest value, positive or negative, in a sample of data (p)
- Peak-to-peak amplitude is the largest excursion of a vibration cycle measured between adjacent positive and negative peaks. (p-p)
- RMS = root mean square of the spectrum – energy total
For a simple harmonic wave , these values can be expressed in terms of rms or peak; In a simple harmonic wave the rms is equal to 0.707 pico, and peak to peak is twice the peak value.
- The amplitude of a vibration is the level of vibration in a data sample..
- Peak Amplitude is the largest value, positive or negative, in a sample of data.
- Peak-to-peak amplitude is the largest excursion of a vibration cycle measured between adjacent positive and negative peaks..
- RMS = root mean square of the spectrum – total energy with a number k of spectral lines, and each line with its own RMS amplitude
2.3 the periodic movement
A movement that repeats itself at equal intervals of time, it is called periodical. A periodic motion can be divided into a number of harmonic motions..
For any non-harmonic wave, as shown in the following figure, o valor rms it cannot be converted to peak and vice versa.
Below you can see a periodic waveform and its spectrum where you can see the harmonics of the rotation frequency.
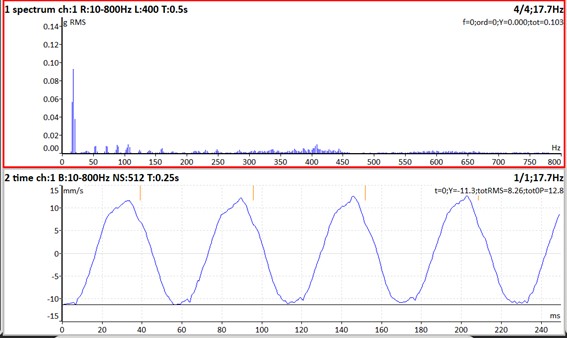
A periodic motion can be decomposed into harmonic motions.
The positive amplitude is not, normally equal to the negative amplitude in a non-harmonic waveform. The peak value is the greater of the positive or negative values. Therefore, the peak-to-peak value will not be equal to twice the peak.
Multiplying the rms by 1,414 not a true peak unless the vibration is harmonic; that is, the vibration contains only one frequency.
Many instruments show a peak value that is 1,414 times the rms value. This is not a true peak value unless the waveform is sinusoidal and contains only one frequency..
Note that the rms value is related to the vibration energy of the machine. For example, the rms value of the waveform shown in the previous figure is 0,103 g rms and the peak value is 12,8 mm/s. Note that when multiplying the rms by 1,414 a new value will be obtained for the peak. This is often called the derived peak..
The RMS value of the vibration displayed in a frequency spectrum can be calculated from the following formula:

measurement units of vibrations
As Units of Measure used to assess the amount of machine vibrations are shown in Table .
Table – Vibration measuring units
| measure | Units | Description |
| displacement | μm p-p* | machine movement, structure, or rotor, voltage related |
| velocity | mm/s | Rate of change of displacement relative to time; related to component fatigue |
| acceleration | g** | Related to the forces present in the components. |
vibration displacement
Displacement is the dominant measure at low frequencies and is related to stress in flexible components.. It is expressed in μm peak-to-peak because machine movements are often non-harmonic and, therefore, have different positive and negative peaks. Displacement is used as a measure for low frequency vibrations. [less than 1,200 CPM (20 Hz)] in bearings and structures. Displacement is also commonly used to determine the relative motion between a bearing and its shaft.. In this case it is used at the operating speed frequency and orders. The following figure shows harmonic displacement and acceleration plotted on a graph for a vibration speed of 5 mm/s at various frequencies.
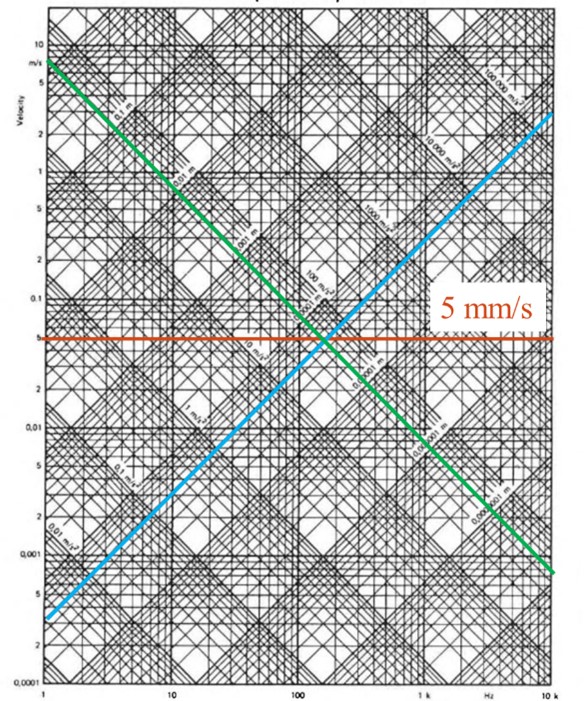
The displacement of a speed of 5 mm/s a 600 CPM (10Hz) is 159 μm pico to pico. The displacement to 60000 CPM (1000 Hz) and just 1,59 μm pico to pico. IS, therefore, It is difficult to measure displacement at high frequencies due to the small amplitude of the vibration relative to any noise present in the signal..
vibration speed
Velocity is the rate of change of displacement with time.. is dependent on both, of displacement and frequency, and is related to fatigue. The greater the displacement and/or the frequency of the vibration, the greater the severity of machine vibration at the measurement site. Speed is used to evaluate machine condition in the frequency range from 600 CPM (10Hz) a 60000 CPM (1000 Hz).
Acceleration of vibration
Acceleration is the dominant measure at high frequencies. It is proportional to the force on a machine component such as a bearing and is used to assess machine condition when frequencies exceed 1000 Hz (60000 CPM). In the previous abacus a vibration to 1000 Hz is equal to 3,25 g of acceleration. But acceleration to a vibration at 10Hz (600 CPM) and just 0,03 g. Acceleration is a poor measure at low frequencies because the signal amplitude is low..
Phase relationship between displacement velocity and acceleration
The following figure shows a graphic illustration of the relationship between harmonic displacement, velocity and acceleration
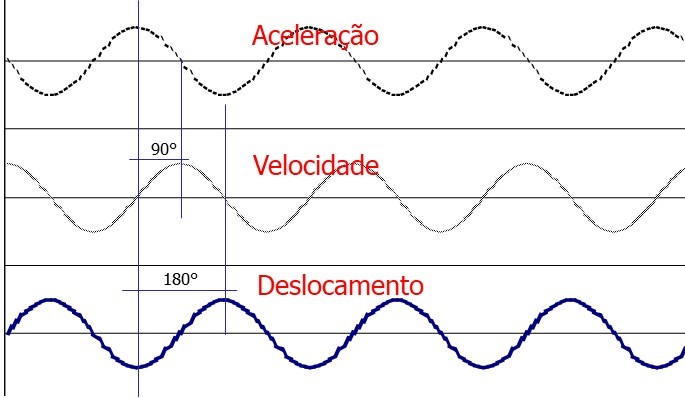
Note that the phase angle is equal to 90º between displacement and velocity.. Velocity drives displacement; that is, velocity is ahead of displacement in time (Figure 1.7). Displacement lags acceleration by about 180°. This means that its peak occurs later.
2.4 Conversion between measurements in harmonic motion
The relationship between the magnitude of displacement of velocity and acceleration of a harmonic vibration is:

f = frequency, cycles/s
D = displacement, the calculation is a little more complicated
V = speed, mm/s
A = acceleration, mm/s2 (divide by 9807 mm/seg2/g to get acceleration in g)
Example of waveforms and spectra in displacement velocity and acceleration
The formulas relating to the displacement speed and acceleration we see also that the speed is equal to the displacement times the frequency, and the acceleration is equal to the displacement times the square of the frequency. Thus it is expected that the higher frequencies are where the vibrations appear with greater acceleration.
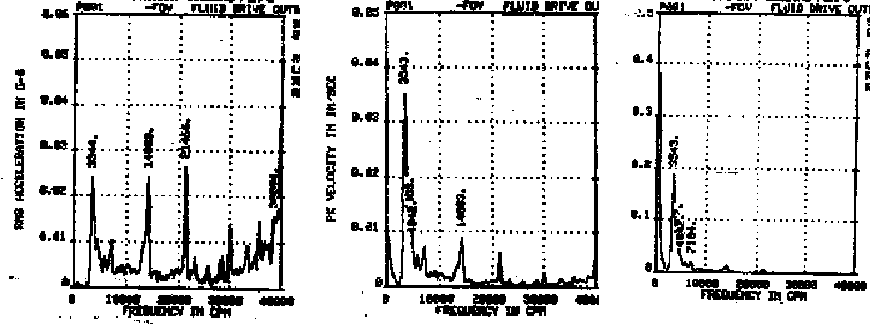
Displacement Speed Acceleration
In the spectra of figure, obtained in the same measurement point, it can be seen that effectively the vibrations at high frequencies manifest themselves mainly in acceleration.
If you want to know why this is so click here.
In practice this translates into that, while if you want to control with a meter vibration phenomena that manifest themselves at high frequencies, such as the first signs of bearing damage, the measurement parameter is the acceleration using.
3. Measurement of vibration – The vibration sensors
The vibration sensors, convert a mechanical movement to a voltage signal. They are normally calibrated to produce a certain number of millivolts per unit of vibration. – for example, 200 millivolts per thousand. The scale factor is, therefore, in millivolts per unit of vibration.
Mechanical vibration is measured by a transducer. (also called a pickup or sensor) which converts vibration movement into an electrical signal. The units of electrical signal are Volts (V) or, more usually, milivolts (mV). There is 1000 mV/V; to convert millivolts to volts move the decimal place three times to the left or divide by 1000. The signal measured in volts is sent to the meter, oscilloscope, or parser. Amplitude is calculated by dividing the voltage magnitude by a scale factor in mv/μm , mv/mm/s, mv/g, mv/degree, or some other reason that is related to the transducer used.
Vibration information is obtained by transducers positioned on the machine at optimal locations.. Transducers convert mechanical vibrations into electronic signals that are conditioned and processed by a wide variety of instruments.. These instruments provide the necessary information to monitor the condition of the machine., check the performance, diagnose defects, and identify parameters. For evaluation, the magnitude is used., the frequency and phase between two signals.
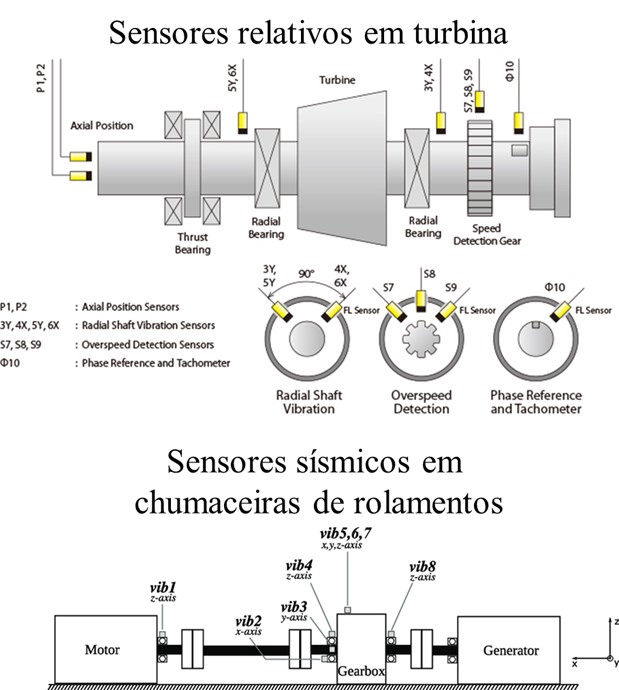
Transducer selection is based on sensitivity, required size, selected measure and on the speed and design of the machine.
The response of any instrument, including transducers, determines how well the instrument responds to stimuli (voltage or vibration) at a given frequency. Analysts want equal frequency response at all frequencies.
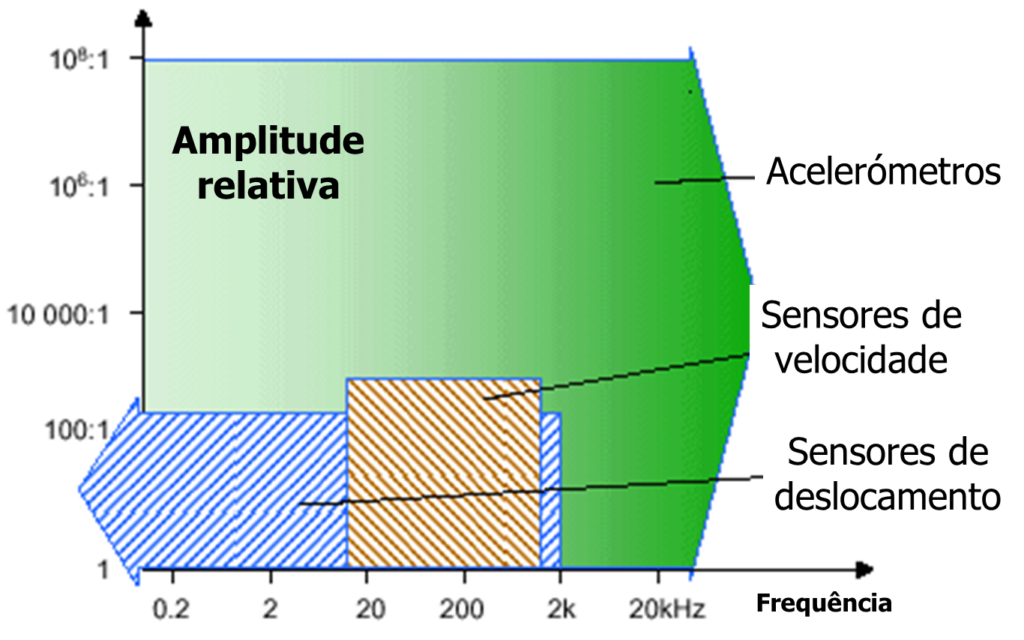
Typically in the industry are three types of transducers:
- displacement
- velocity
- Acceleration
Frequency and amplitude response of these sensors
Below you can see the measurement ranges of these three types of sensors.
3.1. Displacement sensors for measuring relative vibrations
The displacement sensors, widely used in machines with oil film bearings, are also known for:
- Relative displacement sensors;
- Proximity sensors or proximitors
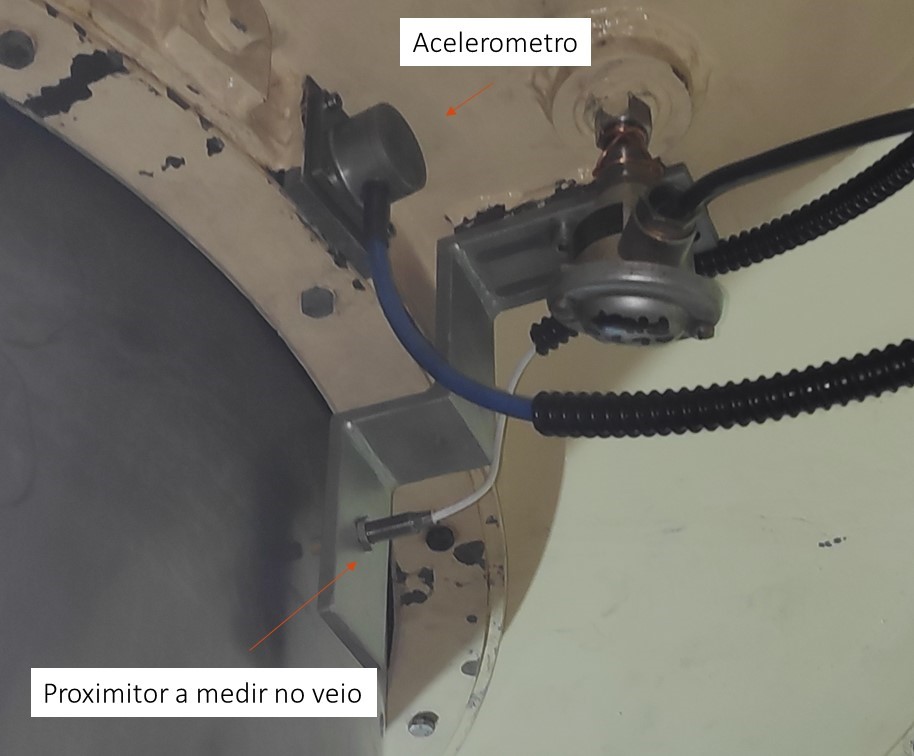
proximity sensors, also designated Inductive Displacement Transducers, contactless, by Eddy Currents, are attached to the bearing bracket and measure shaft vibration relative to the proximity sensor mounting position. Two sensors are usually mounted at an angle of 90º. The horizontal sensor is always 90º to the right of the vertical sensor when looking at the drive side of the machine.. Note that the horizontal vibration drives the vertical by 90° for a counterclockwise rotation of the shaft.
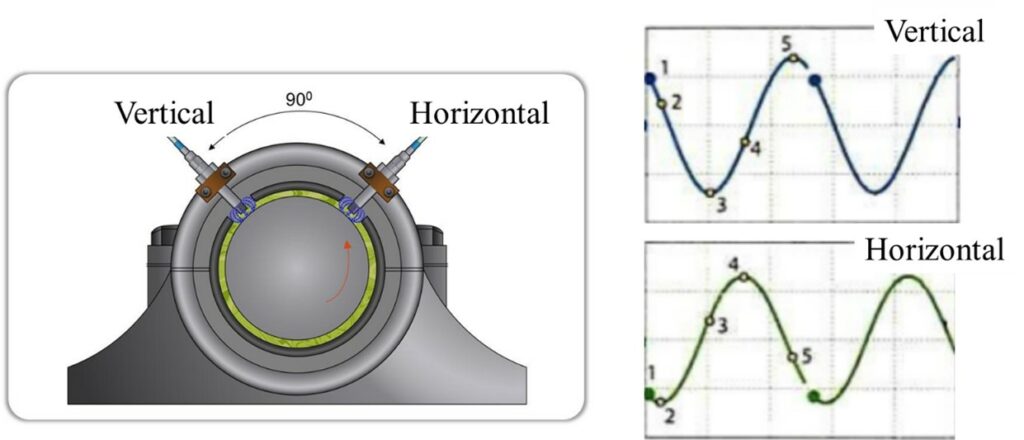
The proximity sensor (non-contact eddy current displacement transducer) shown measures the static and dynamic displacement of a shaft relative to the bearing housing. It is permanently mounted on many machines for monitoring (protection) and analysis. Applications of the sensor to vibration measurements in radial and axial position are explained in detail in the API standard 670.
How the proximitor works
The sensor consists of a coil of wire surrounded by a non-conductive plastic or ceramic material contained in a sealed body.. A demodulator-oscillator is needed, often referred to as an actuator or approximator, to excite the probe to about 1.5 megahertz (MHz). The resulting magnetic field radiates from the sensor tip. When a shaft is placed close to the sensor, eddy currents are induced that extract energy from the field and lower its amplitude. This decrease in amplitude gives an AC signal directly proportional to the vibration. (mv/μm). The DC voltage of the demodulator/oscillator varies in proportion to the distance between the probe tip and the conductive material. The sensitivity of the probe is generally 8 mv/m with a variation (distance between probe tip and shaft) of 0 a 2000 μm. The oscillator/demodulator requires a power supply of 24 v DC negatives. The probe must be insulated and earthed..
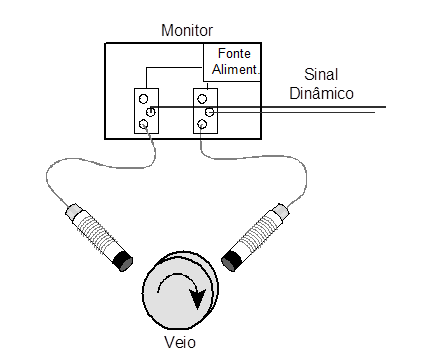
Below you can see a real assembly on a machine.
Pros and cons of proximitors
- Benefits
- Measure vibrations directly on shafts.
- On machines with oil film bearings, It takes place a great vibration damping. Thus the shaft vibration measurements are often much larger than the measured vibrations in the bearings. In this type of machines, phenomena sometimes occur that can only be detected by measuring the vibrations directly on the shafts..
- Measured vibrations to DC ( 0 RPM).
- Because the comparators function as contactless measuring vibrations almost to 0 RPM.
- When installed in pairs, by bearing, determining the position of the center of the shaft.
- Measure vibrations directly on shafts.
- Disadvantages
- The measures are influenced by the finish of shafts.
- The irregularities and vibrations are measured as ovalizações.
- Only measure vibrations up 1 KHz.
- The frequencies above 1 KHz the amplitude of the displacements caused by physical phenomena in the materials is so small that irregularities blend with the surfaces of the shafts.
- The measures are influenced by the finish of shafts.
- Sensors are installed permanently.
For this reason it becomes a more significant investment that is justified only in larger machines, with anti-friction metal bearings.
Here you can see an article about displacement sensors.
3.2. speed sensors for measuring vibrations (absolute or seismic)
The velocity transducer is a seismic transducer (that is, measures the absolute vibration) which is used to measure vibration levels in bearing covers and housings in the range of 10Hz to 2,000Hz. The transducer is self-excited – that is, requires no power supply – and consists of a spring-mounted permanent magnet wrapped in a cylindrical coil of wire. The movement of the coil relative to the magnet generates a voltage proportional to the speed of vibration.. The self-generated signal can be passed directly to an oscilloscope, meter or analyzer for evaluation. A typical speed transducer generates 20 mv/(mm./sec) except at frequencies below 10Hz which is the natural frequency of the active element. Reducing the output signal to values below 10Hz requires a compensation factor., frequency dependent, be applied to the amplitude of the signal. The measured phase also changes with frequency., at frequencies below 10Hz. The velocity transducer can be used to evaluate the vibration velocity in order to assess the condition of the machine when the frequency range considered is comprised in the constant frequency response zone. (10-2,000 Hz) of the transducer.
Velocity transducers can be used to measure vibration with a fishtail stick, a wooden accessory that fits the transducer. A V-notch allows the stick to be mounted on the rotating shaft. Keyways and other changes to the shaft surface pose safety hazards.
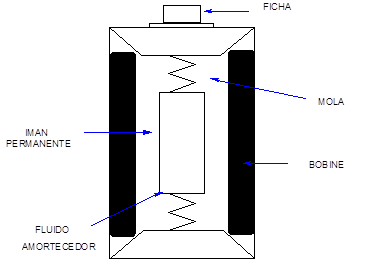
Advantages and disadvantages of speed sensors
- Benefits
- are self-generators
- No need signal conditioning system
- Disadvantages
- High frequency lower limit (10 Hz).
- The natural frequency of these sensors, normally undertaken in time of 10 Hz. This means that measures the vibrations around this frequency are enlarged. Normally the gauges working with these sensors are devices for filtering vibrations at these frequencies.
- Reduced upper limit frequency (1000 Hz).
- The oil damper having inside dampens the higher frequency vibrations 1 KHz. They are therefore not suitable for detecting faults in bearings..
- It has moving parts.
- Are subjected to, so the wear, malfunction, etc.
- side elevational Sensitivity.
- This means that in addition to measuring vibrations along their main axis, they also measure them in lateral directions..
- High frequency lower limit (10 Hz).
Today are falling out of use due to the fact that accelerometers replace them with multiple advantages.
3.3. acceleration sensors for measuring vibrations (absolute or seismic)
These sensors are mostly used in machines with are often used to accommodate changing conditions.. You accelerometers most common are of the piezoelectric type. In them the generated electrical charge is proportional to the acceleration to which they are subject.

Accelerometers are used to measure vibration levels in covers and bearing housings, and are the transducers normally supplied with data loggers.
How an accelerometer works
An accelerometer consists of a small mass mounted on a piezoelectric crystal that produces an electrical output proportional to the acceleration when a force is applied to a vibrating mass.. Force transducers such as modal hammers and force sensors also contain a piezoelectric crystal., but the output of the crystal is proportional to the applied force. The piezoelectric crystal generates a high impedance signal that must be modified by load or voltage conversion, for low impedance. The size of an accelerometer is proportional to its sensitivity. small accelerometers (the size of a pencil eraser) have a sensitivity of 5 mv/g (1 g = 9807 mm/s2) and a constant frequency response of 25 KHz. A 1000mv/g accelerometer that is used for low frequency measurements, can be as big as a speed transducer; however the limit of its usable range of frequencies may be up to 1000Hz.
accelerometer application
The analyst must know the properties of each used accelerometer. If vibration speed is desired, the signal is normally integrated before being analyzed. This unit has its own characteristic frequency response and low-frequency cutoff filters.. Accelerometers are recommended for permanent seismic monitoring because of their long life and because their lateral sensitivity is low.. (Cross sensitivity means that the transducer generates a signal in the X direction from the vibration in the Y direction). Yet, the noise in the wiring, the transmission distance and the temperature sensitivity of the accelerometer must be carefully evaluated.
Benefits
- Measure high frequencies.
- Typically the measured frequency upper limit is imposed by mounting the accelerometer and can go up to a few tens of KHz
- Measure low frequencies.
- The lower frequency limit is imposed by the amplifier where the accelerometer, and can go up to hundredths of a Hertz
- Measure large and small levels of vibration.
- They are very robust.
- They are insensitive to lateral vibrations.
Disadvantages
They need signal conditioning.
Here you can see an article about piezoeletric accelerometers.
3.4. The assembly of accelerometers for measuring vibrations
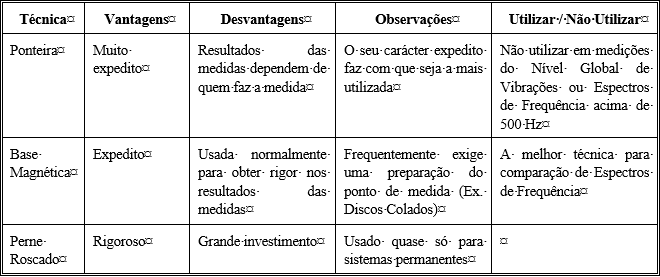
The manner in which the probe is brought into contact with the measurement point significantly affect the results of measures. As a general rule it can be stated that the more rigid is the binding of the probe to the machine, As will be stricter. So the ideal situation would be the accelerometer is attached to a threaded stud. Of course this often, It is impractical, and day to day the most common methods are the fixing with a magnet and the placement of a ferrule on the probe that allows its easy measurement points back to.
This issue becomes critical when making vibration measurements at high frequencies.
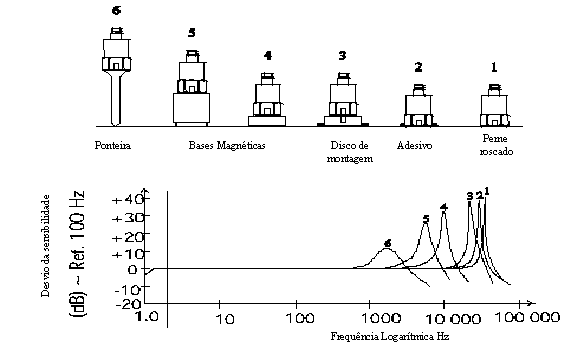
Figure – Frequency response of different fixings of an accelerometer.
When using the tip and the frequency of the vibrations is in the range of 0.5 a 1 KHz it is easy to make measurement errors greater than 100%.
Table given below you can see a comparison of the various techniques.
Below you can see videos with practical examples of the influence of mounting the accelerometers on the measurement results..
3.5. Choose the measurement point for measuring vibration
The reason for measuring vibrations on a machine dictates the position of the measurement point.. When you hold an accelerometer should choose the shortest path between the source of the vibrations (usually the rotor) and a point where measurements can be taken. This usually results from measurements being taken on bearing housings or any rigid structure attached to them..
Another frequently asked question is the direction in which to measure. It is impossible to give a general rule, but often, measure in three directions; vertical, horizontal e axial.
The vibration behavior of machines, especially at high frequencies, It is quite complex. So be expected, that even in very together points vibration levels are different.

Below you can see accelerometers mounted on a bearing of a machine.
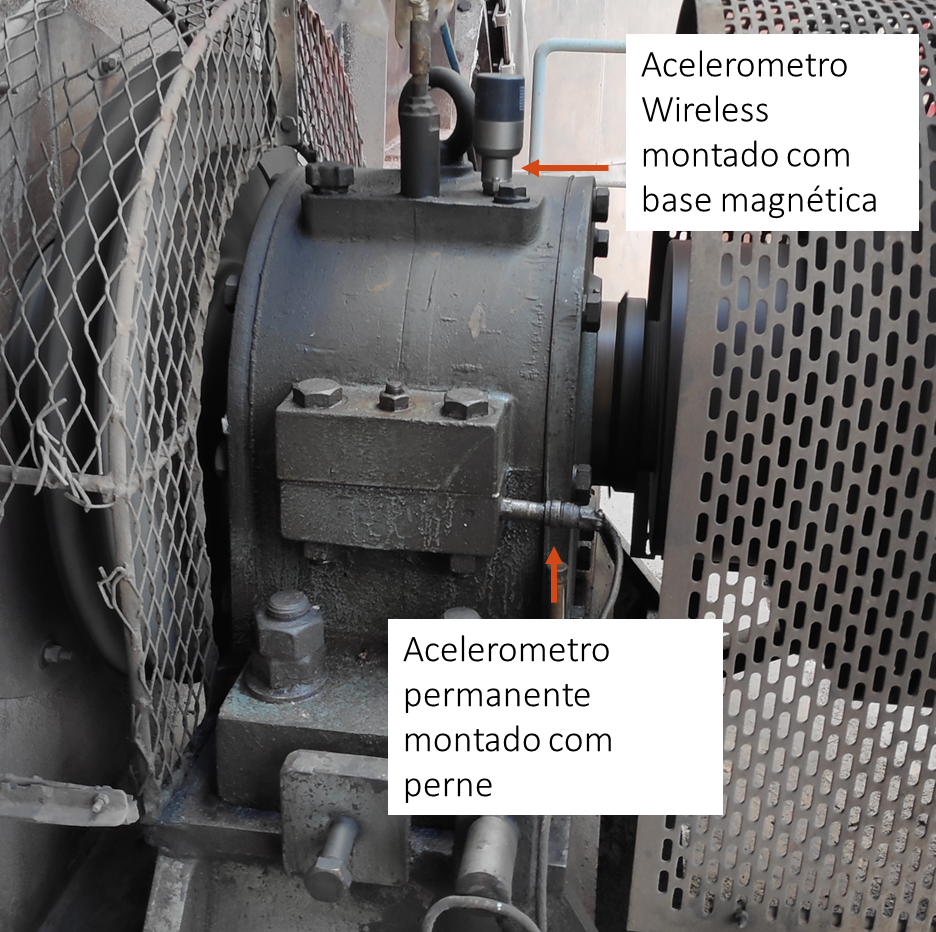
Below you can see a video with a practical example of the influence of the measurement point on the results of vibration measurement.
The scale factor of the vibration sensor
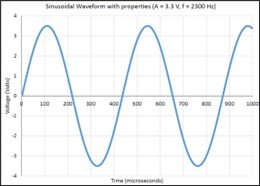
The following figure shows an example of a vibration measurement.. The time waveform in volts (V) is taken directly from the vibration transducer. A built-in accelerometer with a scale factor of 0,4 v/mm/s was used to get the waveform. The measured peak value was 3,3 V. The peak speed is therefore 3,3 V/(0,4 v/mm/s), that is, 8,25 mm/s.
3.6 The phase of vibrations
O phase angle between two signals indicates the relationship of one to the other in time. The two signs can represent vibrations or forces, and their relationship may indicate a condition such as misalignment, the frequency of a critical speed, or the location of a rotor's heavy spot during balancing.
The phase is measured on the time waveform. (amplitude vs tempo) using an analog or digital oscilloscope, a two-channel analyzer, a phase meter, or strobe light.
Phase measurement with reference sensor
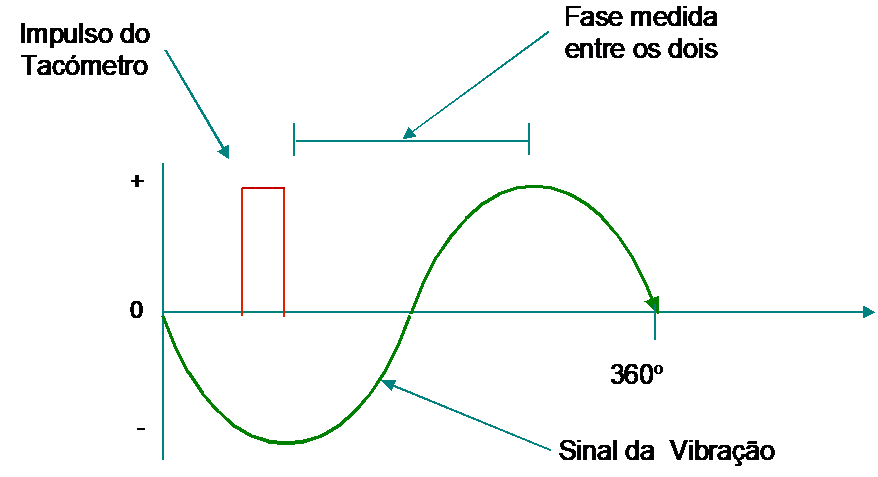
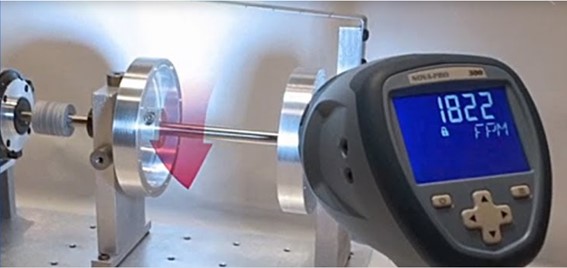
It is essential to obtain accurate differential time measurements of the signals, when measuring the phase. the phase is, sometimes, measured from a reference signal generated once per revolution, by a stationary sensor – for example, an optical pickup, proximity probe, or a magnetic pickup – looking at the optical tape or a key in the shaft. the phase angle, which is related to the time needed to make one revolution of the shaft, is obtained by multiplying 360° by the time between the two events (reference signal and peak vibration signal) divided by the period of the vibration. This phase angle is automatically measured by the analyzers used in the balancing.
Phase measurement with strobe
Phase can also be measured with a strobe light. The strobe light is triggered by the vibration signal – i.e., when the signal changes the voltage from negative to positive, the strobe light flashes – and illuminates a mark on the shaft at some position relative to a protractor. The phase at different positions can be identified by moving the vibration transducer while observing the phase angle.
Phase measurement with two vibration sensors
Two transducers can be used to determine the phase between two locations on the machine, but the location of each transducer must be considered when the data is evaluated. When axial transducers are mounted at 180º, they are 180 outdated graus. Therefore, 180º must be added to the reading of a transducer.
If you want to know more about the phase of vibrations click here.
4 What is frequency analysis in vibration measurement
The vibration meter gives us only a measured level in a wide range of frequencies. In order to know is the individual value of each component is required to make a Frequency Analysis.
A periodic motion can be decomposed into harmonic motions. The total periodic vibration Y shown in the following figure, can be represented by the sum of two harmonic vibrations, y1 e y2.
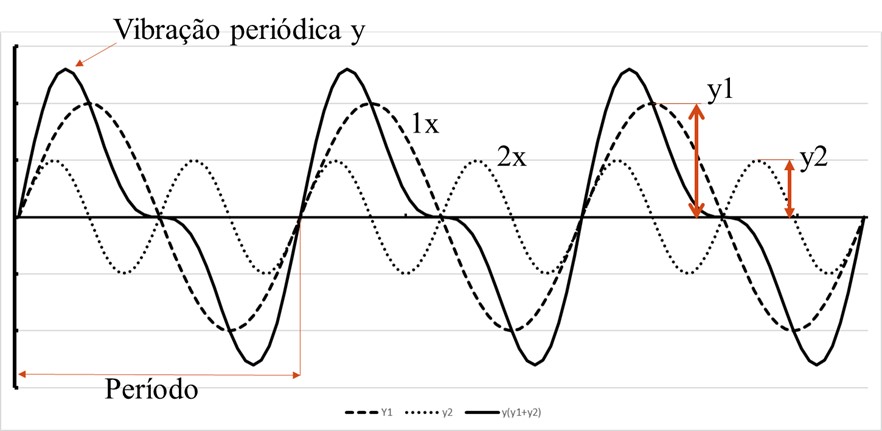
Note that vibration y2 has a frequency twice as high as vibration y1. The y2 vibration is called the second harmonic of the y1 vibration because its frequency is exactly twice (2X) the one of vibration y1. When the vibration frequency y1 is equal to the rotational speed (RPM) machine vibration, the vibration y2 is called second order.
A periodic motion has a specific shape when the two components are in phase as shown in the previous figure.. If the phase of the two components is changed, the magnitude of the peak value of the vibration – that is – the amplitude – will change. The sum of the two amplitudes is not, in general, equal to the peak value of the periodic waveform. Only when the fundamental frequency (1X) leads to second-order component (2X) by 45º or 225º the sum of the peak values of vibrations y1 and y2 will equal the peak value of the total vibration. Other lags will result in a peak amplitude value that is less than the sum of the components..
The amplitude and frequency components that make up the time waveform are shown directly in the frequency spectrum of the following figure. (bottom graph), which shows the amplitude vs frequency.
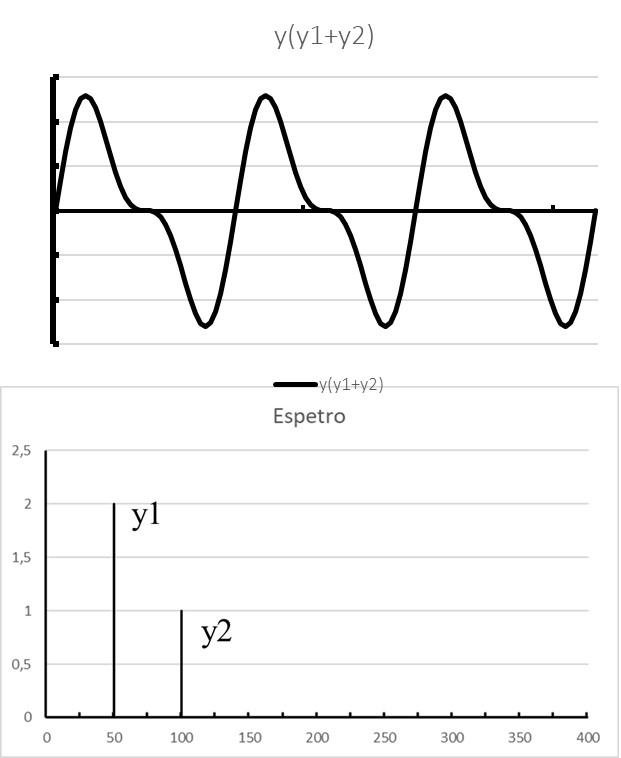
The formation of the frequency spectrum
You frequency analyzers used in vibration measurement use an algorithm called Fast Fourier Transform (English Fast Fourier Transform).
The various components of an operating machine originate, each per se, a vibration at a particular frequency. All these vibrations are added to each other, thus obtaining a total that is the vibration over time.
It is the phenomenon that can be seen on an oscilloscope or what you might feel when you put your hand on a bearing.
In the following video you can see the relationship between the Signal in Time and the Frequency Spectrum.
The frequency spectrum allows breaking that total in individual portions, that give rise.
The amplitude and frequency components that make up the time waveform are shown directly in the frequency spectrum., which shows the amplitude vs frequency. The decomposition of a complex periodic waveform into its components is shown in the spectrum.. The spectrum shows the decomposition of the waveform into its harmonic components. The harmonic amplitudes shown in the spectrum were obtained from a spectrum analyzer. The time domain cannot be reconstructed from the frequency spectrum of this complex periodic waveform unless the phase angles between each harmonic are known..
An FFT analyzer uses a data block collected during a period of time related to the selected frequency range before the process. A computer containing an algorithm (a definite mathematical procedure) do the FFT analysis. The FFT analyzer shows the vibration components in bins, or lines (ex.: 400), equally spaced over the frequency range. Bins can be considered as a series of filters.
The application of the frequency spectrum
Thus it can be said that while the signal at the time is a total, the frequency spectrum shows the shares that give rise.
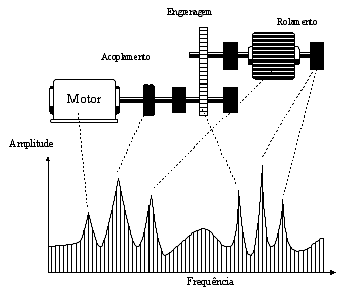
Figure – Through the frequency spectrum can be known which the machine component that causes the vibrations.
If you want to know more about vibration analysis diagnostics click here.
5 Forces generating the vibrations
The purpose of vibration measurement and vibration analysis is to identify defects and assess the condition of the machine..
To relate machine defects to the forces causing vibration, frequencies are used.. It is therefore important to identify the frequencies of machine components and machine systems before carrying out vibration analysis.. Forces are often the result of defective or worn components or are due to design errors or installation issues such as misalignment., ground without firmness, and unfasten.
Because the source of vibration is somehow related to the operating speed, it is important to identify the speed of operation before proceeding with the analysis.
Types of vibration frequencies in machines
- In machines there are two types of vibration frequencies
- As forced – generated by forces created in the operation of the machine
- As natural – which are a structural feature of the machine and components
forced frequencies
The most common forced frequencies are as follows:
- mass imbalance – Spindle rotation frequency(RPM)
- Misalignment – Twice RPM
- Came warped – RPM
- blades and scrolls – Number of vanes or volutes x RPM
- Electromagnetic – Twice the mains frequency
Table Some frequencies of forces associated with the operation of machines
| Source | Frequency (multiple of RPM) |
| Induced by malfunction | |
| mass imbalance | 1x (the frequency is once per revolution) |
| misalignment | 1x, 2x |
| shaft bend | 1x |
| mechanical loosening | odd orders of x |
| distortion in case and foundation | 1x |
| bearings | bearing frequencies, not whole |
| impact mechanisms | multi-frequency depending on the waveform |
| Induced by the project | |
| gimbals | 2x |
| asymmetric shaft | 2x |
| gearing (n teeth) | Nx |
| coupling (m jaws) | Mx |
| sliding bearings (oil swirl) | 0,43x to 0,47x |
| blades and shovels (m) | Mx |
| alternative machines | multiples of half RPM & total speed, depending on the project |
natural frequencies
- Depend on machine design – mass and stiffness
- Causes high vibration if the natural frequency is equal to or close to a forced frequency – phenomenon called resonance
If you want to know how to identify natural frequencies click here.
The natural frequencies are determined by the design of the machine or a component. They are properties of the system and depend on its distribution of mass and stiffness.. All systems have a certain number of natural frequencies. They are not, Yet, multiples of the first natural frequency (with the rare exception of simple components).
Natural frequencies are not important in machine diagnostics unless the frequency of the force occurs at, or close to the natural frequency or impact occurs on the machine. If a frequency caused by forces is close to a natural frequency, There is one resonance, and the vibration is high because the machine easily absorbs energy at its natural frequencies.
Below you can see a historical case of resonance .
critical speeds
If a frequency of the force is an order of the operating speed of the machine, is called a critical speed. Only the natural frequencies in the range of variation of the force frequencies, are interested in machine vibration analysis.
- Critical Velocity – Machine Velocity Equals a Natural Frequency.
- Vibration will be high at critical speed if vibratory forces are present and damping is light
vibration modes
The vibration modes of a system are associated with its natural frequencies..
The form assumed by a system when vibrating at its natural frequency is called its mode of vibration.. A vibration mode does not provide information about absolute system motions., but consists of deflections at chosen points. The deflections are determined relative to a fixed point in the system usually at one end of a shaft.. Absolute motions can be determined only when damping and vibration are known.. An example of a vibration mode of a flexible rotor is shown in the following figure..
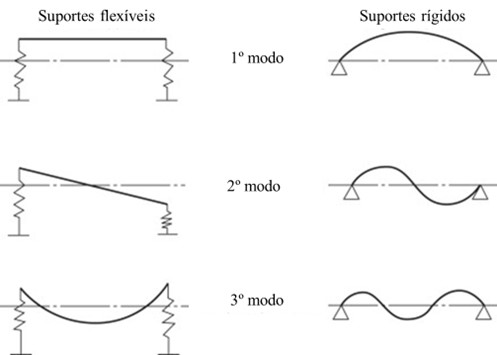
The vibration modes of rigid motors are determined by the flexibility in the supports. Flexible rotors can vibrate in laterally moving modes, torsion, and axial. The point, in a vibration mode, at which the deflection is zero is called a node. Obviously, transducers should never be mounted on a node.
6 Vibration measurement techniques
5.1. The measurement of the overall level of vibration in accordance with ISO 20816-3
This type of measurement gives a simple reading Effective Speed. The measured vibration values can be compared directly with the normalized values of vibration severity criteria of the Standards.
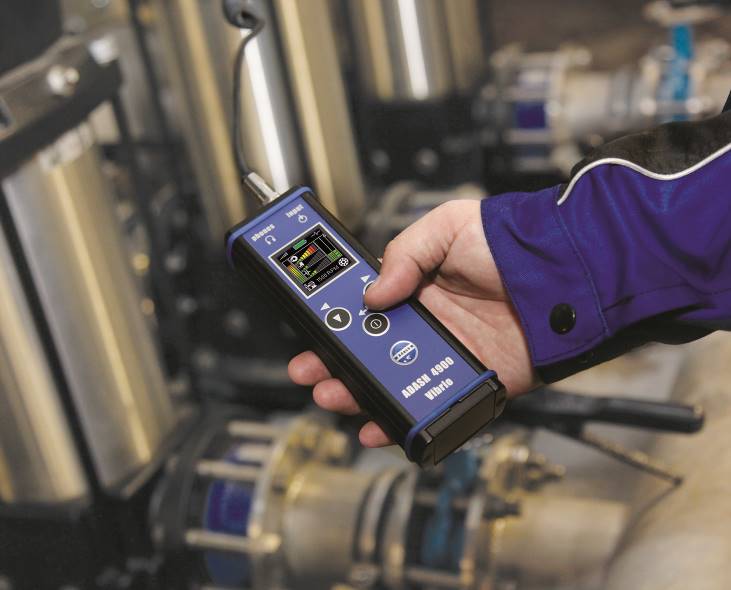
That's how this type of equipment is used in quality control and monitoring of simple machines condition, that up are the most common, such as e.g., electric motors, bombs, fans.
The defects that are controlled with this measurement are usually imbalances, desalinhamentos, days off, desapertos
The bearing failures are the most common fault that this technique does not handle in a satisfactory manner.
Advantages of this technique:
- simple to use
- reduced investment
Disadvantages
- limited sensitivity
- only detects failures in bearings in the final stages of degradation
5.2. Measurement of vibration – O bearing condition check (measuring the acceleration of vibrations to higher frequencies 1 KHz)
The vibration produced by a bearing in the beginning of deterioration is beyond the perception capacity of the human senses.. Effectively, not only is its amplitude reduced, but also the vibrations generated in it are submerged in the other vibrations generated by the machine..
The general problem of detecting anomalies in a bearing is how to separate the minuscule vibrations produced by the impact of the rolling elements, the roll a well lubricated surface, with the edges of a microscopic crack, not detectable with the naked eye, other machine vibrations.
The fact that the Global Level Measurement of Vibrations, (10 Hz – 1000 Hz) often not giving a satisfactory response to the detection of this type of failure was what led to the study of this subject.
In order to understand the solutions that have been arrived at for the detection of faults in bearings, it is necessary to know the way in which vibrations manifest themselves as the degradation of the bearing evolves..
5.2.1 Vibratory symptoms of a bearing in degradation
Consider the case of a bearing fault degradation outer race, a machine that runs e.g. 3000 R.P.M..
1STAGE
The effect of fatigue phenomena are produced micro-cracks under the bearing surface. Have bursts place vibrations at very high frequencies (hundreds of Kilo Hertz) which are called Acoustic Emission. Typically these vibrations are lost in the machine background noise.
2second phase
The micro-cracks reach the surface of the track.
The edges of the slit are sharp. They occur when the impacts they produce shock waves very abrupt. These produce vibration shocks that extend 300 KHz. The vibrations produced are very small and less than the background vibrations produced by the machine until about a few kHz.
3second phase
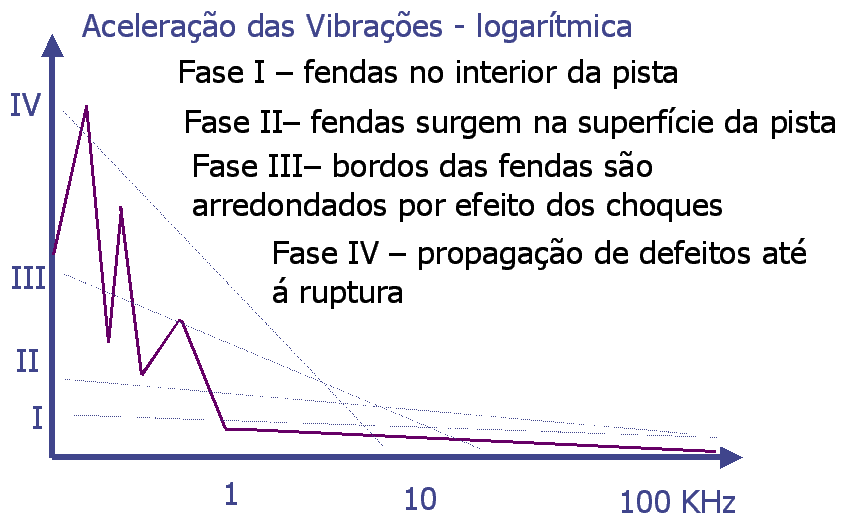
The slit increases and the successive impacts of the rolling bodies round their edges. The vibrations produced now extend only to about 100 KHz and increases the amplitude of vibrations at low frequencies.
When there are vibrations at frequencies below 500 Hz defects are clearly visible.
4STAGE
The track surface degradation becomes significant and easily viewable. The starting material has the effect, completely round the edges of the fissure. The vibrating effect can be detected in the mid-range, and end at low frequencies.
5.2.2. The status monitoring bearings – Limitations of this technique
All methods intended to detect faults in bearings at an early stage, They do it by measuring the vibrations at high frequencies.
As it can be easily inferred from that stated above, the methods of detecting faults in bearings through measurements at high frequencies, start from two principles:
- When a roller breaks down vibrations are produced at high frequencies.
- The only existing vibrations at high frequencies are produced by a degraded bearing.
In everyday life are many situations where this is not true, where the limitations of such measures.
first limitation
The first limitation relates to the fact that this technique for bearings lose sensitivity to rotate at speeds below 1000 RPM, and be of questionable effectiveness at lower speeds 600 RPM. Actually this speed range no longer produce shock vibrations at high frequencies as described above.
Second limitation
The second limitation is the fact that high frequency vibrations are rapidly damped in materials and its amplitude is drastically reduced by the separation between the surfaces of machine components. It is thus that the measurement point is not located in proximity to the rolling technique loses sensitivity, or even crashes.
third limitation
The third limitation comes from there are other sources of vibration at high frequencies.
These limitations have, therefore, to be considered when using this technique.
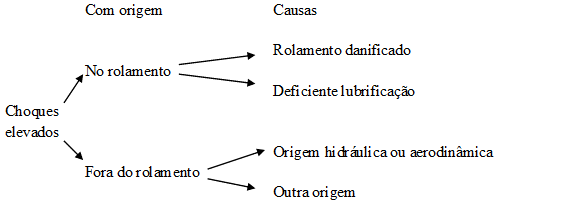
The diagram in Figure it appears that the measurement result from vibration at high frequencies and high amplitudes indicate to say that a bearing is degraded goes a long way.
Phenomena from outside of bearings that can generate vibrations at high frequencies are different:
- cavitation
- aerodynamic phenomena
- Shocks gear in poor condition
- Shocks of loose parts
- Etc.
If the vibration originates in the bearing, still yet, it may be that he is not in poor condition. If the lubricant is not being done under suitable conditions will occur in the lubricant film breaks, you should separate the rolling elements of the tracks, that will give, therefore place the occurrence of shocks such as would occur if the bearing was run down.
Technicians with experience, when a first measured bearing high levels of vibration at high frequencies, They make a rule, with which to undertake a lubrication of the same. Immediately levels will fall. If after some time (for example: three days) the level has not returned to rise, then the problem was due to poor lubrication. If the level, on the contrary, go back to the previous one, you are facing an effectively degraded bearing.
How then overcome these limitations?
5.2.3. The status monitoring of bearings - to overcome the limitations of this technique
actually, if somehow they are insurmountable, technical utility can often be jeopardized.
Experience shows that an isolated measurement, few results can be drawn, due to limitations in.
However, if instead of a measurement, to carry out a sequence of measurements most limitations can be overcome.
In virtually all facilities where this technique is applied successfully, proceeds to the regular measurement of vibration levels of the machine. Not evaluating the state machines based on a single measure, but yes, based on a set of measures.
Through regular measurements determines a normal level, and the results of new measures then compared to this reference level.
5.3. Measurement of vibration – the frequency spectrum analysis with a vibration analyzer
simple vibration meters, such as the aforesaid, Global measure the level of vibration in a wide frequency band. The measured level reflects the amplitude of the principal components of the spectrum, which it is evident, It is important to control. But when this vibration is analyzed in frequency and spectrum placed in a graphic form, the level of many more components, possibly important, it is disclosed. This technique is called Vibration Analysis.
Not only the increase of the amplitudes of the components in the frequency spectrum gives an early indication of faults, but also the frequency at which they occur indicates which parts of the machine are deteriorating. For each measurement point will be characterizing frequency offset, misalignment, days off, problems gears, etc. that are, therefore, diagnosed with the help of Frequency Analysis.
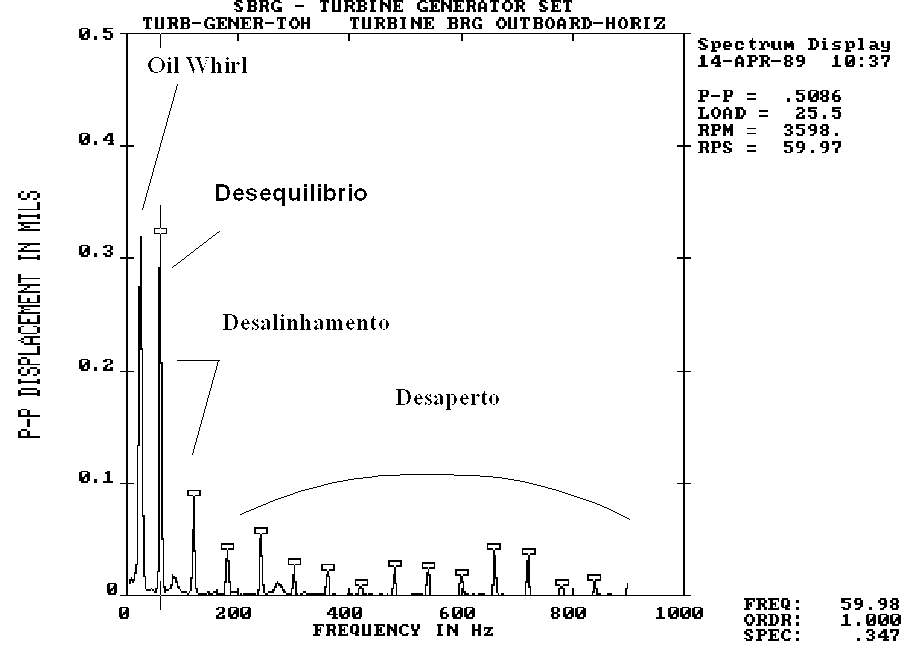
Frequency spectrum analysis allows the diagnosis of faults
Advantages of use
- Diagnosis
- It has no rotational speed limits
limitations
- Cost
- qualification requirement of the operator
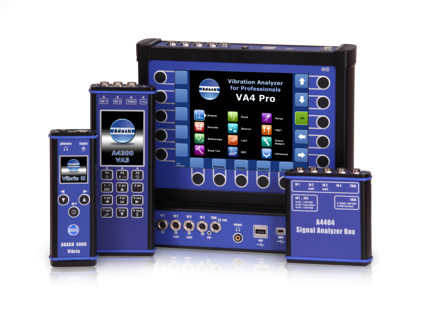
In the picture above have come up several vibration analyzers.
Here you can find courses on diagnosis by vibration analysis.
6. Measurement of vibration – evaluation of the results of the measures
When, after stating that a given machine needs to be put out of service for maintenance work, it turns out that after all it is in good condition, this is a less happy situation from time to time may occur. If the alert was given under a condition of the control system of the machine, It is one of the worst things that can happen to your discredit.
The correct evaluation of the measurement results is one of the main success factors of a machine inspection system..
There are multiple criteria that can serve as a basis for evaluating the results of the measures.
Here you can find a link to several articles about vibration limitss in different types of machines.
6.1. Evaluation criteria in vibration measurement
- Rules
- Figures provided by the manufacturers of measuring equipment
- Values provided by machine manufacturers to control
- Comparison with values measured under identical machines
- Experience
- Trend Tracking
6.1.1 – The series of ISO standards 10816 e 20816 in vibration measurement
The rules relating to acceptable vibration levels are often used as a first guide to assess the operating condition of the machines. some standards, as ISO 10816 e 20816 specify limits depending on several factors.
ISO standards 20816 – Mechanical vibrations – measurement and evaluation of machine vibrations – recommend that the vibration measurement range cover all relevant machine frequencies, which of course will vary from machine to machine.
Below you can see a history of normalization of vibrations
The ISO Standard 20816-3 – the classification of the machines
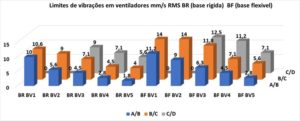
In the 3 this standard, that is specifically dedicated to field measurements in industrial machines with rated power above 15 kW and nominal speeds between 120 r / min e 15.000 r / min machines are first classified according to their type, shaft power or height and stiffness of the support structure.
- Group 2: machines with power between 15 kW 300 kW ; electric machines with shaft height between 160 e 315 mm – with rigid or flexible base
- Group 1 : machines with power between 300 kW 40 MW ; electrical machines with shaft height greater than 315 mm – with rigid or flexible base
As for the support they are classified as rigid and flexible. A support is considered rigid in a certain direction., when the natural frequency of the combined machine and support, lower, in the direction of measurement, is at least 25% higher than the rotational speed of the machine.
They are considered two vibration assessment criteria:
- whereas the amplitude of the vibrations
- given variations of the amplitude of the vibrations
The ISO 20816-3 – the classification of
To evaluate the vibrations in machines based on their magnitude are considered four zones:
- zone: the vibrations of a new machine generally fall in this area
- zone B: machines with vibration levels in this area are considered that are normally able to be operated for extended periods without restrictions.
- zone C: machines with vibration levels in this area are considered that are not normally able to be operated for extended periods without restrictions. Generally the machine can be operated for a limited period until an opportunity arises to take corrective action..
- zone D: Vibration levels of this magnitude are normally considered likely to cause damage to the machine.
This standard indicates limit values for the levels that are valid for measurements carried out in the radial and axial directions in thrust bearings.
The limits are applicable in terms of effective and efficient speed shift, applying the latter to machine at low rotational speeds.
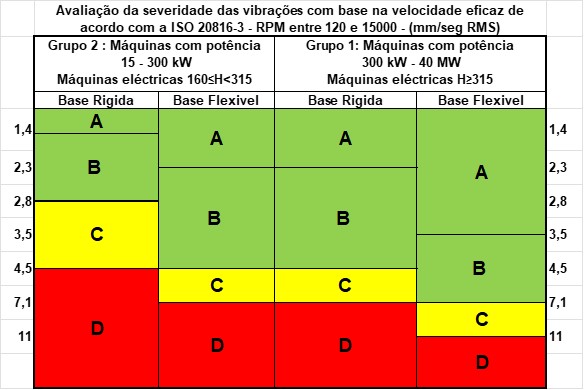
Other criteria specified by this standard relates to the vibration level variations. In particular, that when an increased or decreased level of vibrations to higher 25% the upper value of the zone B, this variation must be considered significant, specially for sudden.
For the definition of alarm values the standard recommends that this exceeds the reference values, by a level equal to 25% the upper value of the zone B.
For machine stop recommends using not greater than 25% values of the upper zone C.
Where these values can not be applied, are produced by vibrations of gears and bearings.
If you want to know more about vibration limit standards click here.
6.2. – Measurement of vibration – values provided by the measurement equipment manufacturers
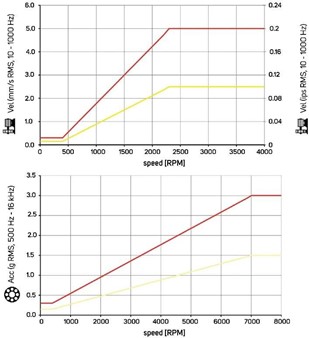
Most manufacturers of vibration measuring equipment provide tables with criteria for evaluating the results of measurements taken by their equipment..
– Criteria based on standards
The values provided for the evaluation of Level Global measurements of vibrations usually are based on the values of standards.
– own criteria of meters
The values provided for evaluating the condition of bearings are generally characteristic of each type of meter.
The former have the limitations mentioned above. The latter have the limitations inherent to this type and method of controlling bearings.
These devices work by measuring a particular band of vibrations at high frequencies, and assuming that these are exclusively originated in the bearings. When the bearing degrades, the amplitude of vibrations in this frequency band increases, thus detecting the failure.. Thus a bearing in good produce, under normal conditions, vibrations with an amplitude determined, being able to build a table for assessing the status of bearings.
This would work fine if no other sources of vibrations at high frequencies. However, the reality is that there are other sources thus resulting in limitations in the immediate application of the tables provided by the manufacturers of this type of meters.
Quite often the meters indicate high values, according to the measuring table, and in the end it appears that the bearing is in good condition. Occur even situations where the measured values are always extremely high making it impossible to apply these techniques.
This limitation is easily overcome if you already have previous experience on the machine in question because, in these circumstances, already in a position to know whether “shape is defective or”.
So a first step in a particular machine, obtaining high values, We can not ensure that the bearing is in poor condition.
6.3 – Provided values by manufacturers of machine to control
these values, when there are, They are always a good basis for assessing the state of a machine. Unfortunately it is not very often be provided. When data is usually because the machines are already of a certain size, which is not the case of the overwhelming majority.
6.4 – Comparison with Measured Values on Identical Machines
It's a rare machine that is the only of its kind; Most lying in more than one copy, even within the same plant. Thus comparison of results of measurements with one of them the other is one of the most obvious basis to construct a safe criterion of evaluation results.
6.5 – The experience
A good experience is, as in all, an excellent basis for evaluating the results of the measures. After all works very similarly to the previous criteria.
6.6 – Trend Tracking
In each machine there are numerous factors capable of influencing the absolute values of the readings. So the safest method of evaluating the results of the measures, consisting of, after a series of measurements, during which it is known that the machine is in good condition, using the measured value, classified as normal, For reference, and define acceptability criteria / limits from it.
Assuming that the evolution of the trend (constant / growing) It is more important than the absolute values, is achieved thus have a criterion that eliminates the constant errors and takes into account the specific characteristics of each machine. IS, for example, the only way to build a reasonable judgment on machines that are not new.
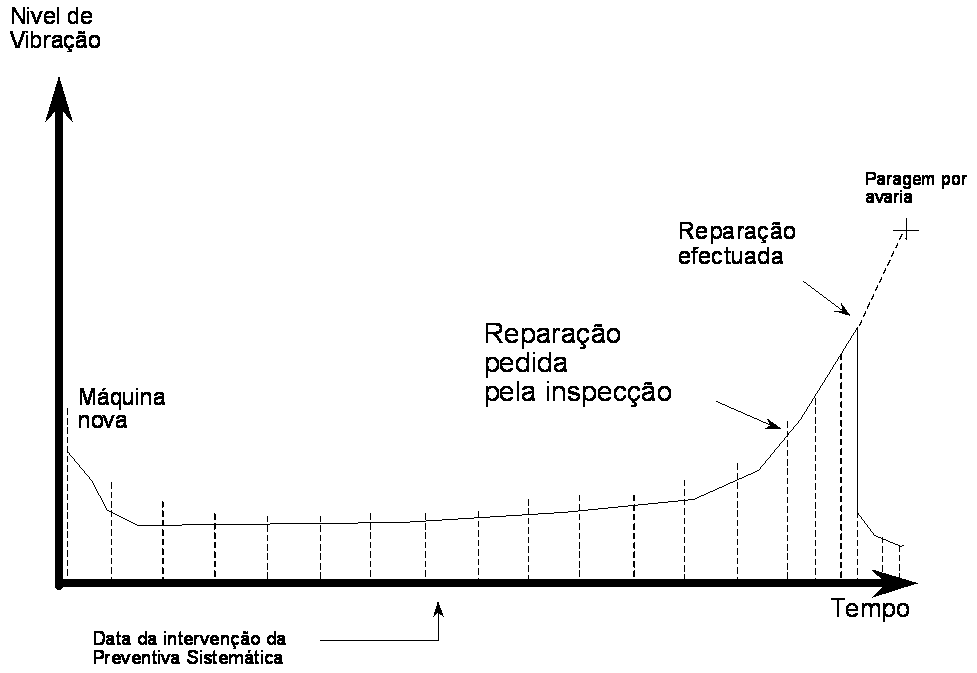
The Trend Tracking

