Turbomachinery and Bodé
An important measurement made using the order tracking capability of vibration analyzers is that of the turbomachinery starts and stops e Bodé.
This article belongs to a series, which constitutes the support material for the course on vibration analysis in turbomachinery. Links to the other articles can be found on here.
Importance of data acquired in a transitory regime
On many machines, the only time they operate at certain important speeds (that is. critical speeds, in structural resonances, etc.) is during a start or stop.
The transient vibration provides a large amount of information that is not available from steady state data.. Among them are:
- The ability to compare the amplitude of vibration, a fase, the position of the shaft, etc., at speeds above and below critical spindle speeds
- The best signature of the rotor's global natural frequencies, which are normally the result of the complex relationship between the rotor supports of the rotor (bearings, vedantes, etc.) and the dynamic nature of the rotor itself
Just as important as the comparisons listed above is the ability to compare transient data before and after a machine problem exists.. Machine status assessments are much easier when you have the ability to compare before and after.
In the same way, it is very importantand evaluate many different types of charts to display vibration data. Using only one type of chart limits the machine specialist's ability to obtain a “image” proper state of the machine.
This measure is an important indication of the condition of the machines and is generally used to qualify new high speed machines or after overhaul. The measurement uses the residual imbalance in the machine to excite it at different frequencies, since it works up to operational speed and measures the response (magnitude and phase) as a function of speed. This uses the basic order tracking capabilities of the vibration analyzer together with special features for displaying the results of this measurement..
or bodé
Bodé plots are a common method of displaying transient data. Typically exhibit global or synchronous vibration (However, nX data can also be displayed) and corresponding phase, versus rotation speed.

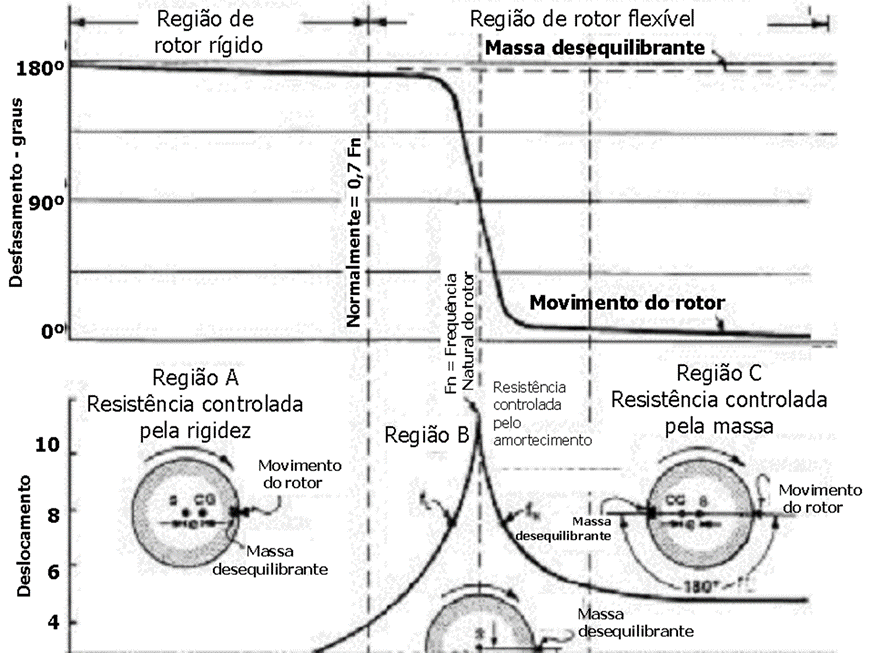
Turbomachinery and Bodé – Figure 1– The BODÉ Diagram of starting a machine, showing the critical speeds. The upper graph shows the level of vibrations, the middle one the phase and the lower one the rotation speed. The level of vibrations and the phase are displayed depending on 1 x RPM
A benefit of Vibration analyzers to this extent, is its ability to simultaneously follow multiple orders and display them, beyond the fundamental rotation speed (1ª order); as well as the general level and the rpm profile as seen in the figure.

Turbomachinery and Bodé – Figure 2– BODÉ diagram of starting a machine, with 2nd and 3rd order presentation, as well as the machine's overall level and RPM.
The natural frequencies of the rotor can be determined by locating the peak in the vibration amplitude that also corresponds to a phase shift of approx. 180 degrees.
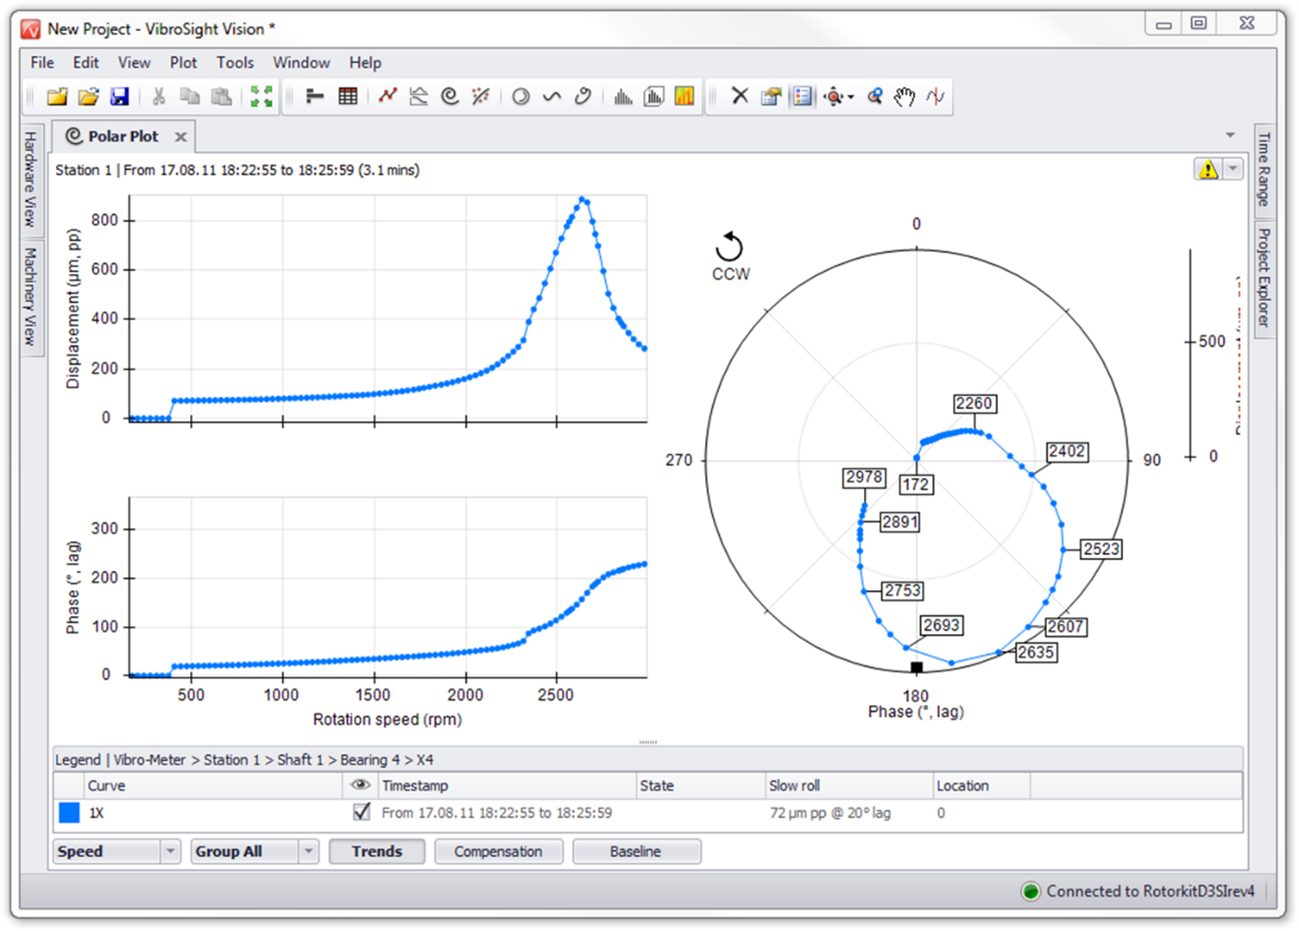
Polar plots show the same data as Bodé plots, just in a different format. Sometimes, polar plots make it easy to determine when the rotor has crossed its critical speed, because the phase change is obvious (that is, to each 180 degrees on the graph). For example, from the Bodé graph shown in the previous, it is not immediately obvious that this rotor is approaching the second critical speed. However, on the polar graph this is very clear.
Turbomachinery and Bodé - Figure 3
Bodé and Polar plots can be compensated for eccentricity (relative vibrations). All areas where the proximitor measures have some amount of physical and/or electrical deviation. The vector data is corrected for this eccentricity by vectorally subtracting the vibration vector at very low rpm from all the vector data obtained..
Example of resonance identified with the Bodé
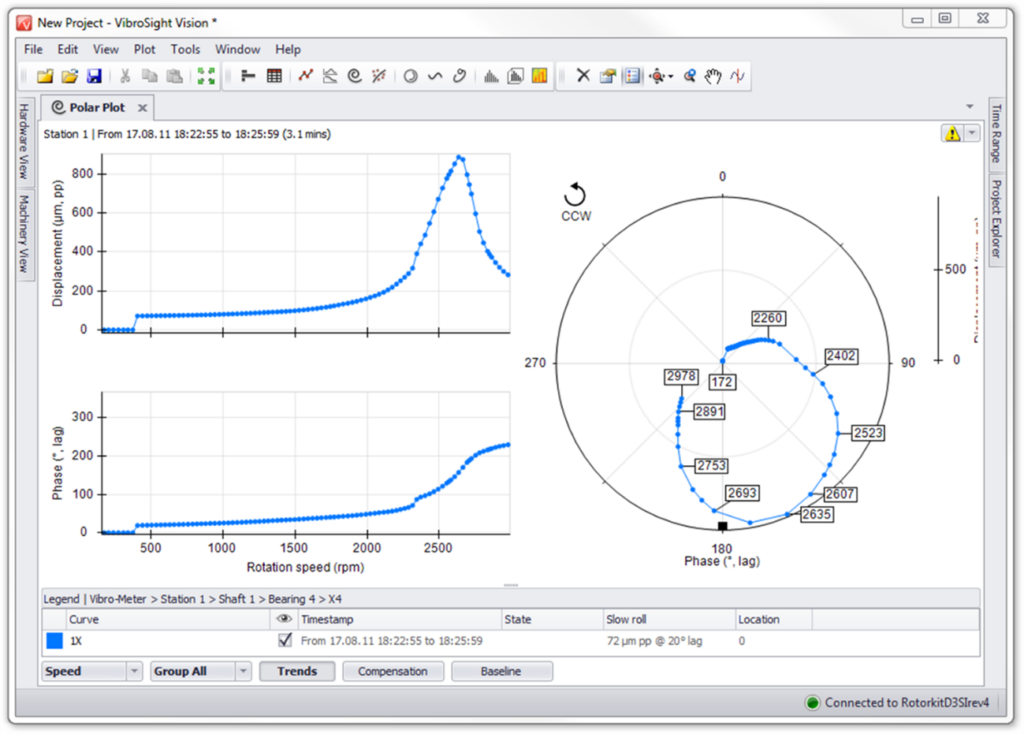
This Bodé diagram shows two resonant frequencies, the first to 2200 RPM, that does not affect the operation of the machine. The second, is the 3515 RPM which is the speed of rotation of the machine giving rise to a phenomenon of resonance.
Turbomachinery and Bodé - Figure 4
Turbomachinery and Bodé – Understanding the Bode diagram
The Laval-Jeff rotor
A basic understanding of rotor dynamics is required to best interpret transient vibration data. The Laval-Jeffcott rotor provides a simplified model of a rotor between bearings, as seen in Figure 1. In this model, the stiffness resides all in the shaft and the mass resides in the entire disc..

Turbomachinery and Bodé - Figure 5 – O rotor Laval-Jeffcott
The unbalanced disk is located in the center of the massless rotor on rigid supports.. The only damping in the system is due to viscous air resistance.. Although the Laval-Jeffcott rotor is a very simple model, it can provide a great deal of information about the effects of synchronous vibration on turbomachinery. A top view of the Laval-Jeffcott rotor shows the relationship between the center of mass (M) and the geometric center (C).

| u | = radius of imbalance |
| C | = geometric center |
| b | = synchronous phase angle |
| M | = center of mass of the imbalance |
Turbomachinery and Bodé - Figure 6 – Top view of the Laval-Jeffcott rotor.
Response of the Laval-Jeff rotor in amplitude and phase with respect to an unbalance
The synchronous phase angle (b) is the difference between the imbalance vector (The) and the displacement vector (R). The synchronous rotation amplitude and phase angle for the Laval-Jeffcott rotor as it passes through the first rotor resonance (critical speed) are shown in Figure 3.

Turbomachinery and Bodé - Figure 7. Synchronous response and phase angle rotor Laval-Jeffcott.
The response amplitude equation is presented in Equation (1).

A physical explanation of these graphs shows that:
- Far below critical speed, the response vector R and the imbalance vector U are in phase (i.e., b ~ 0).
- As the rotational speed increases, the imbalance vector U starts to lead R.
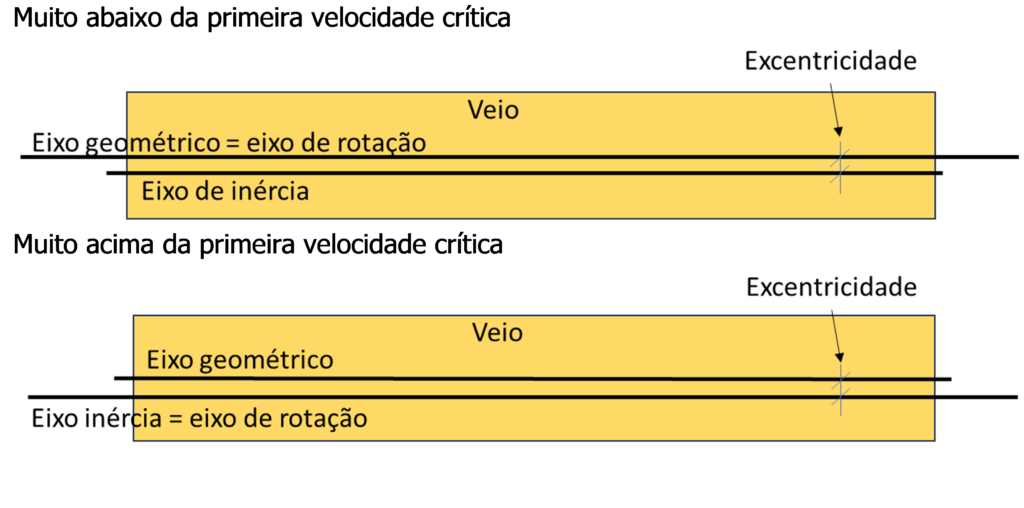
- As the critical speed is passed, b passa por 90 degrees and then asymptotically approaches 180 degrees at speeds above critical.
- Like this, at speeds far above the critical speed, the center of mass of the rotor (M) moves to the center of the orbit of rotation and stays still, while the center of the shaft rotates around the center of mass.
Thus, as shown in the figure below..
Turbomachinery and Bodé - Figure 8
Turbomachinery and Bodé – Physical meaning of phase variation
How can it be explained, then, that starting from the critical speed, the effect of the increase in centrifugal force is not seen due to the increase in rotation speed??
repeating, at speeds far above the critical speed:
- The center of mass of the rotor (M) moves to the center of the orbit of rotation and stays still,
- As the center of the shaft rotates around the center of mass.
see the video:
It is seen that above the first natural frequency the spring does not transmit enough force. (not rigid enough) to move the mass and it's like it refuses to move, due to its inertia.
In other words, much above the critical speed the inertia force is greater than the stiffness force that the spring can transmit, as can be seen in the figure below.
Turbomachinery and Bodé - Figure 9
That is, far above the critical speed the shaft rotates about the center of mass. The amplitude of the movement corresponds to the eccentricity between the axis of inertia and the geometric axis.
Laval-Jeff rotor response in amplitude and phase to forces not dependent on frequency
Additionally, the effect that non-frequency-dependent forces have on the amplitude of rotation is shown in Figure.

Turbomachinery and Bodé - Figure 10 – Synchronous response to a constant force, that is, for example, misalignment.
The effective synchronous response will be a combination of Figures 6 e 10.
Relationship between stiffness forces, damping and imbalance for the Laval-Jeffcott rotor
To figure 11 The following is an illustration of the stiffness forces, of damping and imbalance for the Laval-Jeffcott rotor at speeds below, in, and above the first equilibrium resonance.
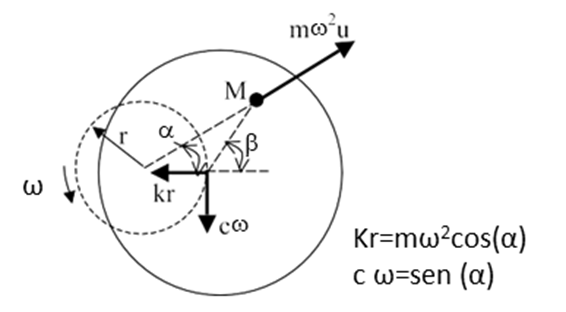
Turbomachinery and Bodé - Figure 11 – synchronous response below, already, and above critical speed.
Thus, the relationship between the stiffness forces, damping and inertia, at different speeds, is what can be seen in Table I below..
Table I Relationship between stiffness forces, damping and inertia, at different speeds

As you can see, far below the first resonant frequency, shaft stiffness is approximately equal to the unbalance force. However, in the resonance, damping is the only term that restricts displacement due to imbalance. Similarly, as velocity increases beyond resonance, the range of rotation, r, approaches the value of the eccentricity of the center of mass, u (assuming that there are no other excitation forces, such as misalignment, internal friction, etc.).
Turbomachinery and Bodé – Amount of damping in the -Q rotor system
Once in resonance, damping is the only force that contains the displacement of the Laval-Jeffcott rotor, measuring the displacement as the rotor passes through resonance is a good method for determining the amount of damping in the rotor system.
The synchronous amplification factor (Q) is a measure of the severity of a resonance, as well as an indication of the damping present. Although there are several methods available to measure Q, the half-power method is used here because it is the most widely accepted. The basic definition is given below in Eq. (2)

The frequency bandwidth is the difference between the frequencies at which the amplitude is 3 dB less than maximum at resonance peak. This corresponds to 0,707 times the amplitude at resonance. This method was adopted by the American Petroleum Institute (API) to measure the synchronous amplification factor.
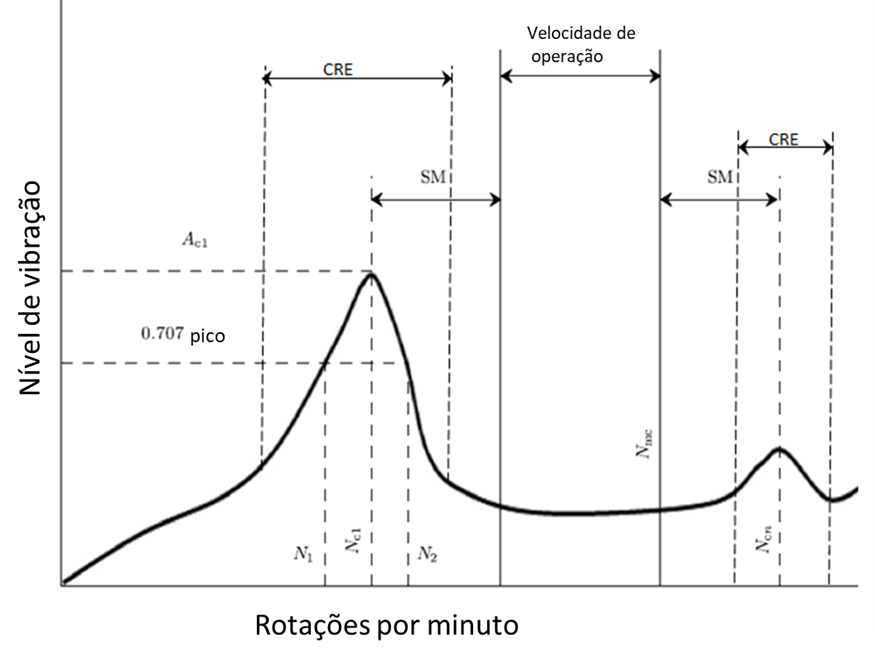
| Nc1 | = Frequency center of the first critical speed (cycles per minute) |
| Ncn | = critical speed |
| Nmc | = Maximum continuous speed, 105 Percent |
| N1 | = lower speed, at 0.707x the peak amplitude of the critical speed |
| N2 | = higher speed, at 0.707x the peak amplitude of the critical speed |
| N1-N2 | = Peak width at half power level |
| Q | = amplification factor = |
| SM | = Separation Margin |
| CRE | = Critical Response Envelope |
| Ac1 | = Level to NC1 |
| Acn | = Level to NCn |
Turbomachinery and Bodé - Figure 12 – Definition of Synchronous Amplification Factor according to the API 617.
In general:
- Machines with synchronous amplification factors less than four are considered to be very well damped..
- Values between four and eight are considered adequately damped and are normally stable..
- between eight and 15 are considered marginal, although many older machines can operate in the area.
- The amplification factors above 15 are considered to have insufficient damping and are very likely to have starting friction and stability problems.
Synchronous amplification factor is an important diagnostic parameter to evaluate machine stability and compare the state of the machine before and after the existence of an equipment problem.. As can be seen in Figure 3, the amplification factor increases as the system damping decreases. Since most of the damping in high-speed machines comes from the hydrodynamic bearings, changes in the synchronous amplification factor may indicate a change in the damping provided by the bearings. What, in turn, may indicate a change in the condition of the bearings.
The Laval-Jeffcott rotor with flexible bearing supports
Since most turbomachinery is supported by hydrodynamic bearings, the effects of flexible supports also need to be considered. Laval-Jeffcott rotor can be modified to have flexible bearing pads (Figure 7).

Turbomachinery and Bodé - Figure 13 – Laval-Jeffcott rotor with flexible supports
Flexible supports are desirable from the point of view of rotor dynamics because:
- Can reduce the dynamic load transmitted to the frame;
- Allow the cushioning at the supports to be more effective (that is, less rigid supports allow more speed on the supports, what is needed for dampening).
Relationship between generated force and transmitted force – Transmissibility
The calculated transmissibility ratio (FB/Fx) for different damping values is shown in Figure 8.

Turbomachinery and Bodé - Figure 14 – Transmissibility versus spindle speed ratio with critical speed
As you can see, damping reduces the force transmitted to bearings in resonance, but actually makes it bigger for ω/ωn > 1,14. This contrasts with Figure 3, where damping has a desirable effect on the range of rotation for the entire speed range. In general, it is desirable (from the point of view of synchronous response and stability) that the relationship between the stiffness of the bearing and that of the shaft (KB/Khe came) be as low as possible, with the obvious restriction that the low bearing stiffness must not cause the machine to run closer to resonance.
Rotor support stiffness directions
Besides that, rotor support stiffness is not always in the main direction (that is, the principal stiffness produces a force opposite to the direction of displacement of the rotor). The stiffness and damping coefficients of a bearing bracket or seals can be divided as follows .
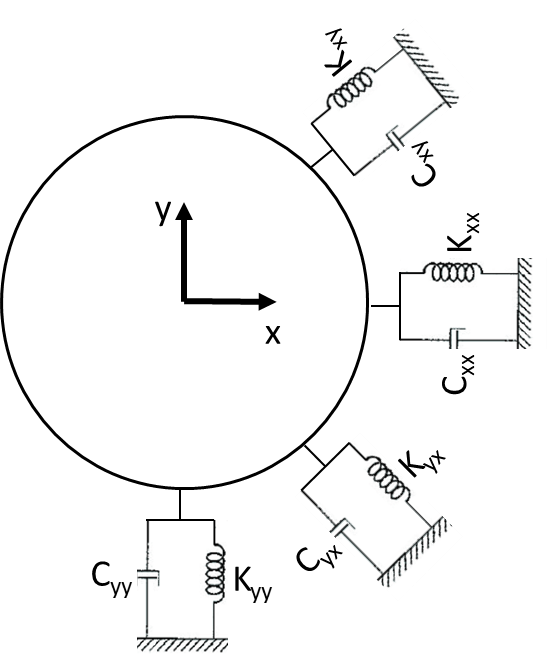
Turbomachinery and Bodé - Figure 15 – Rigidity and damping coefficients of supports.
5 – Rigidity and damping coefficients of supports.
The K termsxy e Kyx are usually designated by terms of “cross coupling” (if the shaft is displaced in the vertical direction, cross-coupling stiffness produces a reaction force in the horizontal direction) and reduce the positive damping effects if Kxy (-Kyx) > 0. For this reason, when Kxy > 0, rotor amplification factor increases and stability is reduced. the equation (3) gives the response of a rigid rotor on flexible supports, including cross-coupling effects. Note that when Kxy > 0, reduces the damping term and increases the amplification factor. For this reason, when the amplification factor is measured from field data, is actually a measure of the combination of direct damping and cross-coupled stiffness present in the machine..

Imbalance, symmetry and the origin of vibrations
The root cause of vibrations most often found in turbomachinery is the imbalance that was inadvertently introduced, for example, in the turbine-generator rotor assembly.
The fundamental point to recognize is that the inertia of each object will generate a force that will tend to make the rotor rotate around its true center of mass when any torque is applied.. This is caused by the inertia of the particles that make up the object when starting the circular motion induced by a binary. The only way to avoid this natural rotation of the center of mass, is through a restraining force that is imposed on the object, to keep it in forced off-center rotation, which forces the true center of mass to move laterally or rotate around the forced axis of rotation.
As a result of this imposed asymmetry of rotation, a part of the total energy supplied by the input torque to accelerate the rotor mass is converted into what is finally observed as “vibration” (more precisely, the radial deflection and lateral translation of the shaft on the rotor journal).
This energy manifests itself in the centrifugal force generated by the inertia of any portion of rotating mass that, is asymmetrical with respect to the axis of forced rotation. This strength is what is typically recognized as “imbalance”. In combination with all the centrifugal force is(s) strength(s) of reaction of(s) Score(s) of constraint that maintains this forced form of rotation.
With regard to the vibration of the generator rotor of a turbine, the vast majority of vibration problems arise when the rotor's intended position and orientation (centered concentrically around its bearings and couplings) does not correspond to where the rotor naturally wants to go when accelerated by torque, given the presence of mass eccentricity (inherent in a rotor or induced by misalignment with other rotors).
The amount of parasitic force (or potency, when considered over time) that acts to drive rotor vibration is directly related to the amount of force required to hold the rotor in its intended operating position when it does not naturally tend to do so.
When mass eccentricity is present, the physical constraints that keep a horizontally spinning rotor in its intended state, but “unnatural”, are the journals maintained by gravity and the couplings (and the connected mass) of adjacent rotors.
The power lost under these restrictions is “stolen” of input torque energy and converted into unwanted dissipation points, namely material, vibration of supporting structures, and into potential energy that deflects/bends the “mola” of the rotor as its mid-mass axis shifts laterally (tour) around the pivot axis, particularly, in the first critical velocity region.
It is important to note that, the purpose of reducing rotor vibration, should focus on restoring the natural rotation tendency (around the axis of the center of mass) to match the designed concentric geometric axis of rotation, centered on rotor couplings, to create the natural dynamic behavior of an ideally concentric rotor.
By doing so, most other dynamic problems (rotor resonant responses, bearing instabilities, etc.) also disappear, once they cease to have a driving force.
From the perspective of more traditional rotor dynamics, the natural assumption is that, below the first critical speed, a rotor is always rotating around the geometric axis, coincident with the axis of the journals, at any speed and any mass asymmetry that creates vibration must be considered as imbalance with respect to this axis of rotation. Like this, it is common for most amplitudes of excessive displacement to be considered as targets to be solved with balance weight forces.
This can create problems when the real source of mass asymmetry in a continuous rotor or rotor assembly comes from rotor misalignment and warping., or when unwanted vibration response is being observed above the first critical speed of the system. Besides that, the placement of weights does not necessarily allow reaching a true state “balanced”, defined as the sum of all forces and the sum of all moments, being zero.
When a true equilibrium condition is not reached, residual axial moments act to bend or distort the rotor, create motion and residual forces and, often, create a self-aligning orientation “natural” modified (within clearances of bearings and seals) that still does not correspond to the axis of the rotor journal. These rotor conditions are identifiable in the vibration graphs.
Turbomachinery and Bodé – The physical meaning of relative and absolute vibrations
The relative vibrations measured by a pair of displacement sensors indicate:
- The relative movement of the shaft relative to the bearings;
- The movement of the center of the shaft.
As absolute vibes, measurements on the bearings, indicate the forces transmitted by the shaft to the bearings.
Turbomachinery and Bodé – The different factors that influence the amplitude and phase of the Bodé
The displacement that you see in a Bodé graph will always be the result of different effects., for example:
- Displacement due to deformation associated with vibration modes when close to and above critical speeds;
- Displacement due to deformation associated with warping and misalignment;
- Displacement due to imbalance;
- Displacement due to oscillation of the shaft journal in the oil film.
To understand the graphs one has to understand how these effects interact..
Turbomachinery and Bodé – the ideal situation
As a group of flexible rotors increases in speed, the rate of increase in the amplitude of the radial deflection, in conjunction with changing the phase angle, indicates how much of the observed vibration amplitude is due to static bending and how much is additionally induced elastic deflection or the associated respective mode of vibration.
not ideal case, the amplitude should remain flat or with very little response throughout the entire speed range and undergoing a phase angle change at any critical speeds as seen in the graphs below.

Turbomachinery and Bodé - Figure 16
Turbomachinery and Bodé – The imbalance
On a Bode graph, the most important identifier of the presence of imbalance is the slope pattern of amplitude in proportion to velocity, in combination with the presence or absence of radial phase angle shift.

Turbomachinery and Bodé - Figure 17
Turbomachinery and Bodé – Run out e empeno e misalignment
If the amplitude at low speed is already different from zero, this is indicative of a rotor warp or imbalance, and is also often proportional to rotor stiffness.
A non-zero amplitude from a low speed and staying flat, and without any phase angle shift, suggests the presence of some relative vibrations or a commitment, or the existence of a possible “crank effect”, on the rotor set due to an eccentric journal or a non-concentric coupling as seen in the following graphs.

Turbomachinery and Bodé - Figure 18
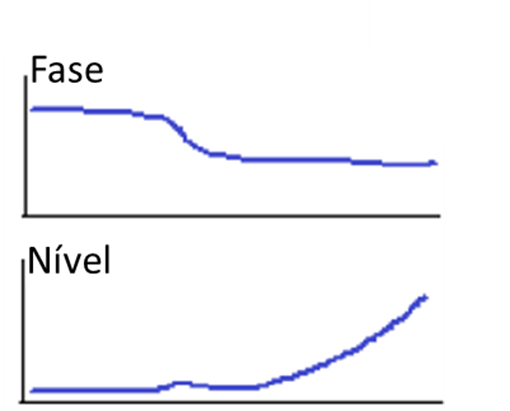
An initial increase in amplitude with no noticeable change in phase suggests pure rotor warping or imbalance being driven by centrifugal force., one orbit of the shaft in the bearing, of increasing amplitude, below the beginning of the first critical velocity region as seen in the graphs below.
Turbomachinery and Bodé - Figure 19
This is the condition where the rotor is being forced to go through a motion, not concentric, with its geometric axis.
If the amplitude continues to increase while the phase angle starts to change, this indicates that a dynamic component/shape of vibration is being added to the gyratory motion as seen in the graph below. If the total phase angle shift is notably less than 180 degrees, this indicates that the amplitude of the orbit of the shaft in the bearing is dominant over any elastic deflection associated with the respective mode of vibration.
Turbomachinery and Bodé - Figure 20
Turbomachinery and Bodé – The influence of the behavior of other coupled rotors
If the phase angle shifts 180 degrees, with minimal change in the range of displacement, this suggests that the rotor driven by a neighboring rotor, which passes through its critical velocity region as seen in the graphs below.
Turbomachinery and Bodé - Figure 21
Similarly, one “boss” of the Bodé plot on the amplitude of the displacement without a phase shift can also come from the response of a neighboring rotor.
Such situations are readily evaluated by reviewing the specific velocity range of the amplitude and phase responses in the Bodé plots of all rotors..
In cases like this, it is very useful to have a Finite Element model of the rotors to identify the inherent natural frequencies of each rotor.
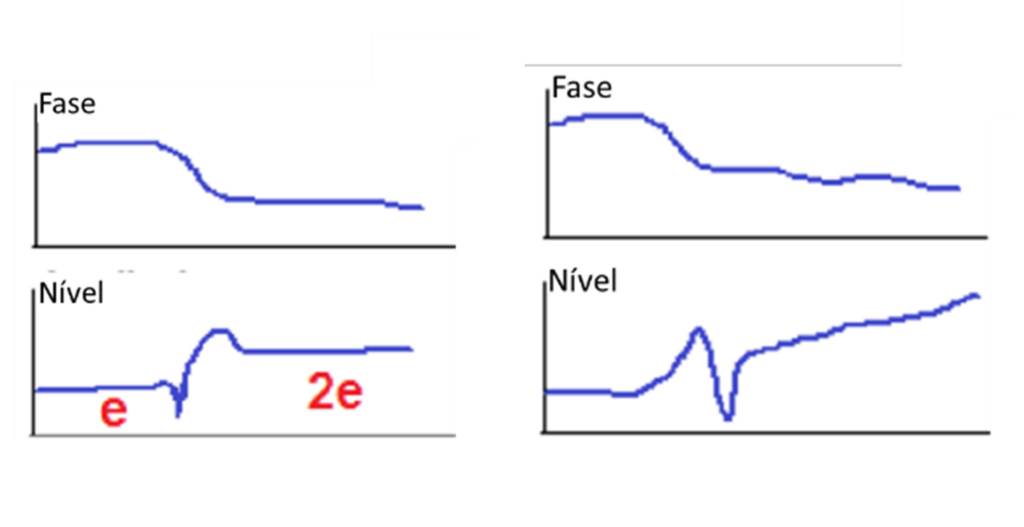
Turbomachinery and Bodé – Rotor oscillation movement – axial asymmetry in the distribution of eccentricity
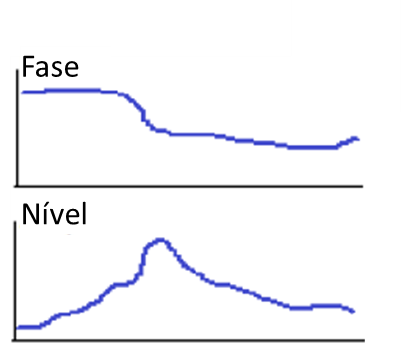
At speeds above the first critical speed, an upward amplitude trend without any noticeable phase angle change is an immediate indication of axial asymmetry in the eccentricity distribution that generates the oscillation/pivot mode as seen in the graphs below.
Turbomachinery and Bodé - Figure 22
Sometimes, an additional amplitude response is observed with a phase angle shift superimposed on the upward trend which is indicative of a resonant response at the second critical speed, as seen in the above graph (right side).
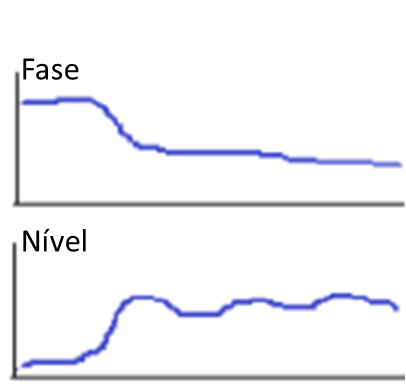
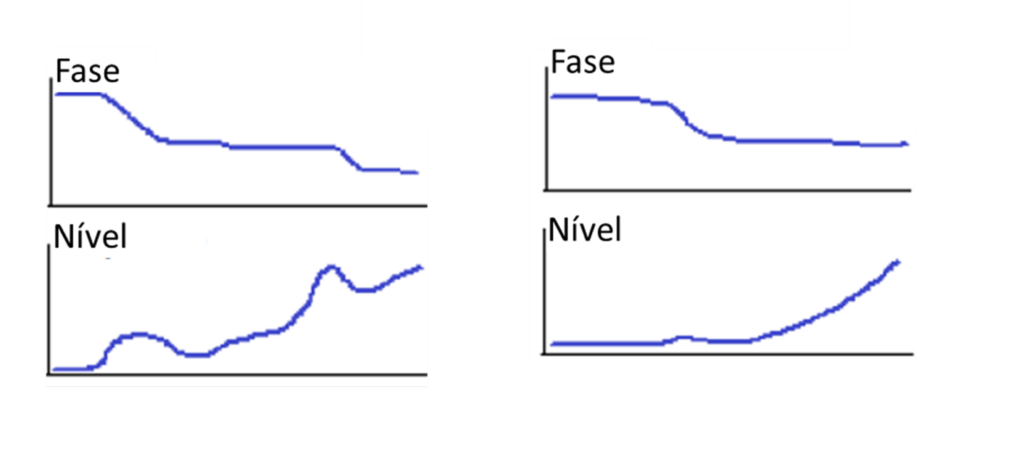
Turbomachinery and Bodé – Eccentricity
Another common indication of eccentricity is when the amplitude above the first critical velocity is approximately twice that measured below the first critical velocity., or just stay high, but somewhat flat as seen in the following graphs.
Turbomachinery and Bodé - Figure 23
This is a function of the rotor changing the position of its axis of rotation as it passes through the critical speed region.. At lower speeds, the sensors measure the direct amount of eccentricity of the mass axis rotating about the axis of the geometric, indicating an amplitude equal to the eccentricity, e. When the rotor is flexible enough, a reduced amplitude at the journal can be measured, since the rotor can mainly “oscillate” or flex in your medium plane, absorbing most of the corresponding force.
At higher speeds, the sensors come “whole rotor” rotating about the axis of inertia while continuing to rotate, such that the sensors measure the intrinsic eccentricity, as well as the measure of the eccentricity, indicating a range of 2e.
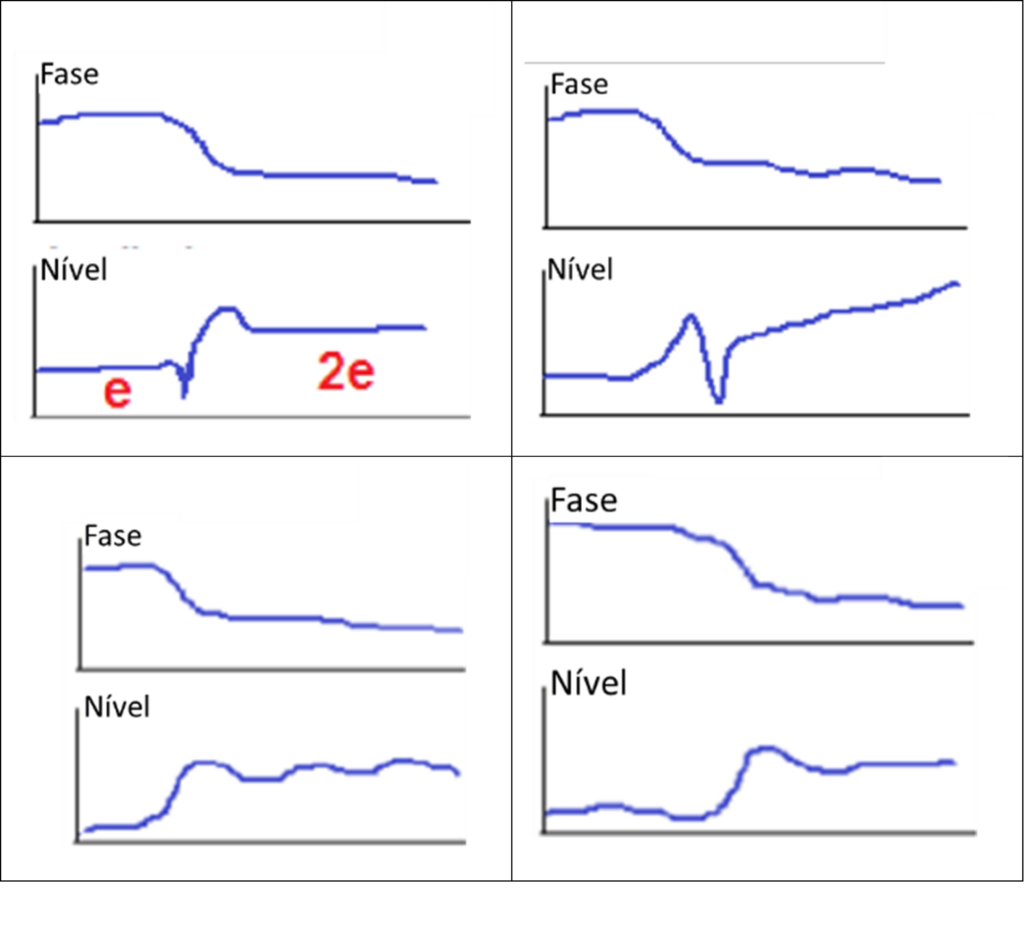
Turbomachinery and Bodé – Amplitude reductions due to the change of position of the axis of rotation
Sometimes, a brief decrease in amplitude is also observed before or after the critical velocity peak. This drop corresponds to a brief moment of self-balancing of the rotor in the transition between rotation axes.. If it's before the critic, indicates that the resonant response is dominant, and if seen after the critic, indicates that the rigid mode driven by eccentricity and centrifugal force is dominant as seen in the graphs below.
Turbomachinery and Bodé - Figure 24