Vibration data collection
The vibration data collection concepts are presented below..
Conversion of mechanical vibrations into an electrical signal
First, the mechanical vibrations are converted by a transducer into an electrical signal in volts..

The quality of the signal obtained from the machine depends on the selected transducer as well as how it was mounted and where it is placed..
Collecting proper vibration data is the key to effective machine monitoring., fault diagnosis, condition assessment, and acceptance test. Quality data collection requires planning that involves the machine, the nature of the expected vibration data, the instrumentation available, and the purpose of the test. Prior to data collection, the analyst must formulate a technically sound and economically viable plan based on the data objective. (that is, monitoring, diagnostics, condition assessment or acceptance tests).
Topics considered in this chapter include measurement selection (displacement, speed or acceleration), the transducer, and transducer mounting and location. Because all data is digitized before being saved, collection time and sample sizes should also be considered when collecting data so that adequate data can be provided. displays for analysis and evaluation. The key to quality work in the field of vibration data collection is proper data collection..
Vibration data collection – schoice of a measure
A measure is a unit or standard of measurement that provides a means of evaluating data.. Three vibration measurements are available – displacement, velocity e acceleration. Ideally the transducer will directly provide the selected measurement. Unfortunately, transducer limitations do not always allow direct measurement of vibration in the proper way.
The measurement is selected based on the frequency content of the vibration present, in machine design, on the type of analysis to be conducted (by ex. defects, condition, information about the design), and the information sought.
displacement
O absolute displacement, which is used for low frequency structural vibration (0 a 20Hz), is related to the voltage (shaft or structure) and is usually measured with a dual integration accelerometer. The absolute displacement of a shaft must be measured with a contact transducer or with a non-contact transducer in combination with a seismic transducer. Unfortunately, frequency must also be considered when severity of displacement and acceleration are evaluated.
O drelative displacement from the shaft, which is measured with a proximity probe, shows the extent of bearing play used by vibration and is used over a wide range of frequencies. Relative displacement is usually measured, between bearing housing and rotor, by a permanently mounted proximity probe.
velocity
For machine monitoring and analysis, in general, no interval 10 hz up to 1000 Hz, a velocity is the measure used by default. The velocity, which is the time rate of change of displacement, is dependent on frequency and displacement and is related to fatigue. It has been shown to be a good measure in the range from 10Hz to 1000 Hz because a single value can be used for rms or peak velocity in undemanding condition assessments, no need to consider the frequency. the most modern data collectors use accelerometers and the signal must be integrated to obtain the velocity.
Acceleration
A acceleration is the measure used above the 1000 Hz; is related to strength and is used for high frequencies such as meshing and bearing defects. Acceleration and velocity are absolute measurements taken at or as close to bearing housings as possible..
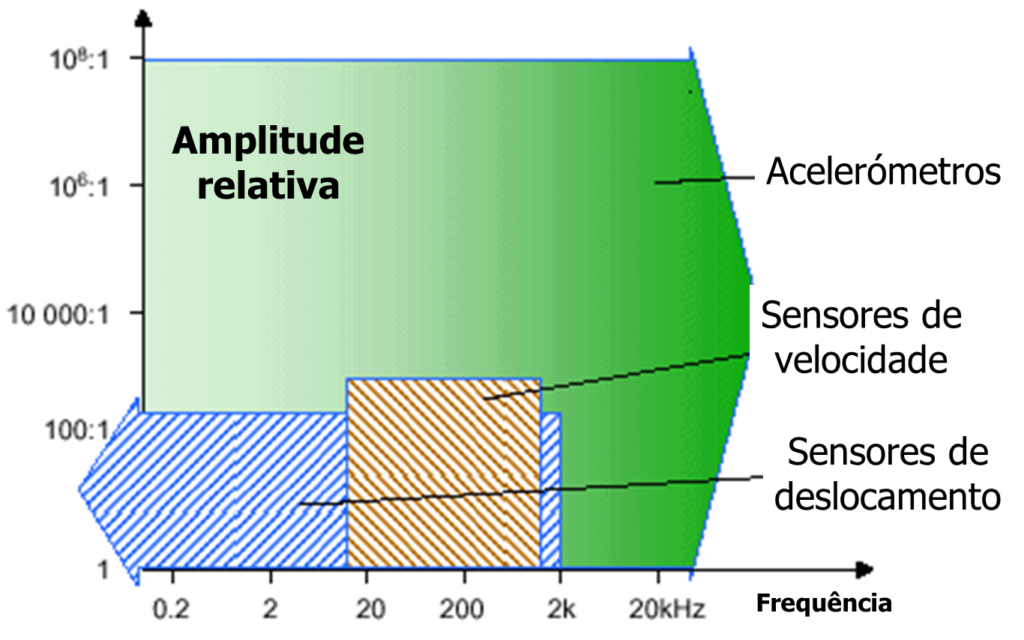
Vibration data collection – selection of a measure based on useful frequency range
Selecting a measure – displacement, velocity, acceleration – for evaluation of defects and conditions of machines is, therefore, based on the useful frequency range of the vibration measurement shown in the table below.
| Measurements | useful frequency range | physical parameter | Application |
| Relative Displacement (Proximity Probe) | 0-1,000 Hz | Tension/Movement | Relative motion between shaft and bearings/housings |
| Absolute Displacement (Seismic) | 0-10 Hz | Tension/Movement | Condition of machines |
| velocity (Seismic) | 10-1,000 Hz | Energy/ Fatigue | Generic machine condition. Medium frequency vibrations. |
| Acceleration (Seismic) | >1,000 Hz | Strength | Generic machine condition. Medium to high frequency vibrations. |
Vibration data collection – schoice of a measure based on the defects to be identified
Some general measurement applications and applicable frequency ranges are given in Table B.
| Component | Interval of frequency |
| shaft vibration | 10 x RPM |
| Gearbox | 3 x GM |
| Rolling elements of supports | 10 x BPFI |
| bombs | 3 x VP |
| Engines/Generators | 3 x 2 LF |
| fans | 3 x BP |
| bushing bearings | 10 x RPM |
Selecting a measure – displacement, velocity, acceleration – for evaluation of defects and conditions of machines is, therefore, too, in the defect frequency ranges.
Vibration data collection – application examples
The table below shows some examples of the application of these rules..
| Machine | Charge | velocity (RPM) frequencies (Hz) | Bearing Type | measure(s) | transducer |
| Gear – single reduction | 9 Mw | 7,500 RPM input 1,200 RPM said GM = 3,000 Hz | fluid film | displacement – he came2 carcass acceleration3 | accelerometer |
| Gear – double reduction | 300Kw | 1,800 RPM input 200 GM Output RPM = 375,725 Hz | 15 rolling elements | acceleration speed | accelerometer built-in accelerometer or speed |
| Steam turbine | 13.4 Mw | 5,000 RPM | fluid film | displacement – he came | proximitor |
| Steam turbine | 500 Mw | 3,600 RPM | fluid film | displacement – he came | proximitor |
| Gas turbine | 50 Mw | 9,000 RPM | fluid film bearings | displacement – carcass acceleration came | accelerometer |
| large induction motor | 3 Mw | 3,600 RPM | fluid film | displacement – he came | proximitor |
| induction motor | 150 Kw | 1,800 RPM | 8 rolling elements | velocity – carcass | built-in accelerometer or speed |
| Motor diesel | 300 Kw | 1,800 RPM | fluid film | velocity – carcass | built-in accelerometer or speed |
| High performance centrifugal pump | 13.4 Mw | 5,000 RPM | fluid film | displacement – came speed – carcass | built-in accelerometer proximitor or speed |
| Centrifugal pump | 150 Kw | 1,800 RPM | 12 rolling elements | velocity – carcass | integrated accelerometer |
| alternative pump | 150 Kw | 300 RPM | 15 rolling elements | velocity – carcass | built-in accelerometer or speed |
| Centrifugal compressor | 750Kw | 5,000 RPM | fluid film | displacement – he came | proximitor |
| reciprocating compressor | 375 Kw | 480 RPM | fluid film | velocity – carcass | built-in accelerometer or speed |
| dryer roller | 300 RPM | 26 rolling elements | velocity – carcass | built-in accelerometer or speed |
1 Only conventional measurements; HFD, envelope and other special techniques not included.
2 shaft = shaft relative vibration
3 housing = bearing housing
Vibration data collection – tvibration transducers
Vibration information is obtained by transducers positioned on the machine at optimal locations.. Transducers convert mechanical vibrations into electrical signals that are conditioned and processed by a wide variety of instruments.. These instruments provide the necessary information to monitor the condition of the machine., check the performance, diagnose defects, and identify parameters. For evaluation, the magnitude is used., the frequency and phase between two signals.
Transducer selection is based on sensitivity, required size, selected measure and on the speed and design of the machine.
The response of any instrument, including transducers, determines how well the instrument responds to stimuli (voltage or vibration) at a given frequency. Analysts want equal frequency response at all frequencies. The transducer provides an electrical signal that is proportional to the vibration it is measuring.? Sometimes, unfortunately, the answer is no. In the following figure, for example, the frequency response curve for a velocity transducer is not constant. At lower frequencies the response is less than the response at frequencies higher than 20 Hz for the same signal strength.
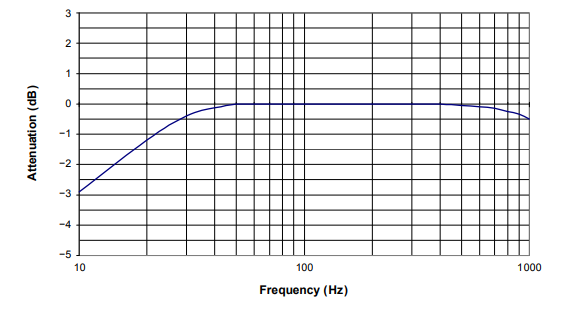
This means that, if the same scale factor as 19 mv/mm/s is used over the entire frequency range, amplitudes at low frequencies will be lower than their current value. The frequency response curves (amplitude versus frequency) as shown in the figure are normally supplied by the transducer manufacturer.
The sensitivity of the transducer is dependent on its output voltage for a given input vibration.; for example, 8 mv/μm , 20mv/mm/s, 100 mv/g. The higher the output voltage per unit of measure, more sensitive is the transducer.
Proximity Sensors
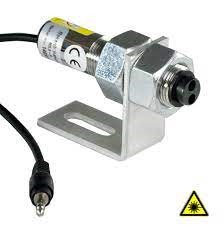
O proximity sensor (non-contact eddy current displacement transducer) shown in the figure below measures the static and dynamic displacement of a shaft relative to the bearing housing. It is permanently mounted on many machines for monitoring (protection) and analysis. Applications of the sensor to vibration measurements in the radial and axial position are explained in detail in the standard in API 670.

The sensor consists of a coil of wire surrounded by a non-conductive plastic or ceramic material contained in a sealed body.. A demodulator-oscillator is needed, often referred to as an actuator or approximator, to excite the probe to about 1.5 megahertz (MHz). The resulting magnetic field radiates from the sensor tip. When a shaft is placed close to the sensor, eddy currents are induced that extract energy from the field and lower its amplitude. This decrease in amplitude gives an AC signal directly proportional to the vibration. (mv/μm). The DC voltage of the demodulator/oscillator varies in proportion to the distance between the probe tip and the conductive material. The sensitivity of the probe is generally 8 mv/m with a variation (distance between probe tip and shaft) of 0 a 2000 μm. The oscillator/demodulator requires a power supply of 24 v DC negatives. The probe must be insulated and earthed..
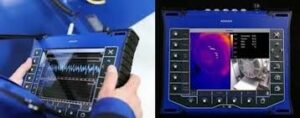
Below you can see a photograph of a real assembly on a machine..
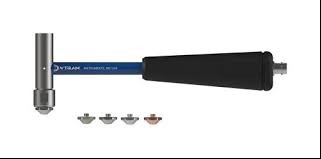
Here you can see an article about displacement sensors.
speed transducers
The velocity transducer shown in the figure is a seismic transducer. (that is, measures the absolute vibration) which is used to measure vibration levels in bearing covers and housings in the range of 10 hz up to 2000 Hz.
The transducer is self-excited – that is, requires no power supply – and consists of a spring-mounted permanent magnet wrapped in a cylindrical coil of wire. The movement of the coil relative to the magnet generates a voltage proportional to the speed of vibration.. The self-generated signal can be passed directly to an oscilloscope, meter or analyzer for evaluation. A typical speed transducer generates 20 mv/(mm./sec) except at frequencies below 10Hz which is the natural frequency of the active element. Reducing the output signal to values below 10Hz requires a compensation factor., frequency dependent, be applied to the amplitude of the signal. The measured phase also changes with frequency., at frequencies below 10Hz. The velocity transducer can be used to evaluate the vibration velocity in order to assess the condition of the machine when the frequency range considered is comprised in the constant frequency response zone. (10-2000 Hz) of the transducer.
Accelerometers and other force transducers
You accelerometers are used to measure vibration levels in bearing covers and housings; are the transducers normally supplied with data loggers. an accelerometer) consists of a small mass mounted on a piezoelectric crystal that produces an electrical output proportional to acceleration when a force is applied in the form of a vibrating mass.
Force transducers such as modal hammers also contain a piezoelectric crystal., but the output of the crystal is proportional to the applied force.
The piezoelectric crystal generates a high impedance signal that must be modified by load or voltage conversion, for low impedance. The size of an accelerometer is proportional to its sensitivity. small accelerometers (the size of a pencil eraser) have a sensitivity of 5 mv/g (1 g = 9807 mm/s2) and a constant frequency response of 25 KHz. A 1000mv/g accelerometer that is used for low frequency measurements, can be as big as a speed transducer; however the limit of its usable range of frequencies can be up to 1,000Hz. The analyst must know the properties of each accelerometer used.
If vibration speed is desired, the signal is integrated into the analyzer.
Accelerometers are recommended for permanent seismic monitoring because of their long life and because their cross-sensitivity is low.. (Cross sensitivity means that the transducer generates a signal in the X direction from the vibration in the Y direction). Yet, the noise in the wiring, the transmission distance and the temperature sensitivity of the accelerometer must be carefully evaluated.
Here you can see an article about piezoeletric accelerometers.
Vibration data collection – dTrigger Devices
When it is advantageous to directly associate vibration data with a rotating shaft or other vibrating object, trigger device is used. This device detects or is timed to the frequency of a brand, bevel, or protrusion of the rotating shaft and sends a signal to an analyzer or oscilloscope that starts collecting data. Therefore data is collected at the same point on the shaft each time the trigger device sends a signal to the analyzer.. The frequency of the trigger signal is associated with the speed or some multiple of it.; the phase between the reference and the vibrating signal can be obtained.
trigger devices – sensors optical
The optical pickup is often used most of the time to get the once-per-revolution reference signal., needed to measure the phase angle between a piece of reflective tape placed on the shaft and a vibration peak at a frequency of once_per_revolution. When energized by light impulses from the reflective tape, the pickup sends a voltage pulse to the analyzer. The analyzer can compare tape timing (shaft reference thrust) with other events – that is, other brands on shaft, vibration peaks – or with your own readings (to determine the spindle speed).
Optical sensors can also be used to observe the time interval between equally spaced marks on the rotating shaft when torsional vibration measurements are taken.. The optics include a sensor mounted adjacent to the shaft, reflective tape placed on shaft, and a power supply/amplifier.
Magnetic Pickups and Proximity Sensors
The magnetic sensor in the following figure, which is self excited, can be used as a triggering device because a voltage spike occurs when the pickup encounters a discontinuity such as a keyway.

The pickup is placed approx. 500 μm of the shaft. Magnetic sensors are used in torsional vibration measurements to produce series of pulses proportional to shaft speed.. If torsional vibrations are present, the time interval between pulses varies, producing frequency modulation.
A disadvantage of the magnetic sensor is that signal conditioning is sometimes difficult because the magnitude of the voltage depends on the speed.. The proximity sensor, that is fed, provides the same shooting function without this drawback.
Vibration data collection – the andstroboscopiO
Strobe light is used to measure speed or phase, in conjunction with a vibration sensor. To measure the speed, the frequency at which the light should flash is tuned to the spindle speed by selecting a mark on the spindle and adjusting the strobe flashing frequency until the mark is stationary. To measure the phase, the strobe light is triggered by the vibration signal when it goes from minus to plus. This means that the focus of light will always be 90º ahead of the measured phase angle..
Transducer Selection
Important considerations in transducer selection, include:
- the frequency response,
- the signal to noise ratio,
- the sensitivity of the transducer and
- the strength of the signal to be measured.
The frequency range of the transducer must be compatible with the frequencies generated by the mechanical components of the machine. Otherwise, another transducer must be selected and the signal converted to the appropriate measurements.. For example, if the intended measurement of velocity is at frequencies above 2000Hz, to obtain the signal, an integrated accelerometer for speed must be selected. If you want to measure the velocity waveform, the signal must be collected from a speed sensor or an integrated analogue signal from an accelerometer, integrated into the data collector or external.
With most data loggers a single transducer is provided – usually an accelerometer due to its small size and frequency characteristic.. The frequency response characteristic of the unit must be evaluated so that the user does not try to detect vibrations to which the collector does not respond.. For example, if a typical collector with an accelerometer is tuned to respond to frequencies up to 8 kHz and a gearbox has gearing at 10kHz, the signal will be rejected. Acceleration is measured and most collectors give readings in either acceleration or velocity.. The selected parameter depends on the chosen criterion.
Transducer Selection – cable care
The cable carrying the signal to the data logger can cause erroneous readings.. Many standard cables are coiled types which are more suitable than standard coaxial construction.. But, because many conductors are flexible at their core, individual edges may fail at stress points as a result of handling or misplacement in the carrier. Additionally, Terminals must be handled with care..
Many accelerometer manufacturers use MIL-type connectors. They have threaded assemblies that can be unscrewed., causing the conductors to twist and break. A failsafe approach is to apply Loctite to all connections when the plug is new.. A spare cable can be helpful in troubleshooting issues about the integrity of the cable in use. These cables are computer connectors and must be handled with care..
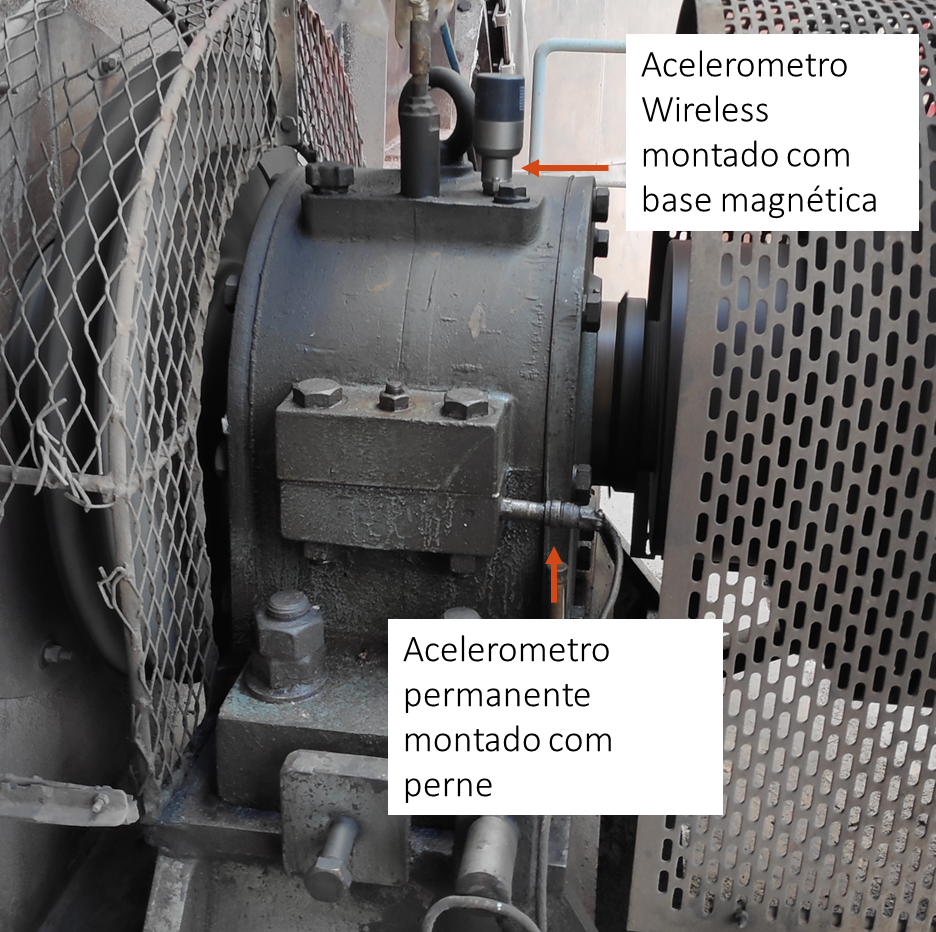
Vibration data collection – a mtransducer count
The method used to mount a transducer can affect the frequency response curve because the natural frequency of an accelerometer can drop, depending on the mounting method used – manual, magnetic, sticker, screwed as shown in the figure.

The mounting method chosen should provide an equal frequency response over the entire frequency range under study.. There is information available on mounting transducers. It can be seen from the table below that a stud mounted on a clean surface, flat and smooth finish provides the highest frequency response. Response progressively decreases for adhesive and magnetic base mounts. Reliability is lowest with an accelerometer held in hand.
The values in the table are intended to serve as guidelines. Each accelerometer and its assembly has a single natural frequency and, therefore, a usable frequency range.
| Method | Attendance Limit |
| manually hold | 500 Hz |
| Magneto | 2,000 Hz |
| sticker | 2,500-4,000 Hz |
| beeswax | 5,000 Hz |
| Pin | 6,000-10,000 Hz |
Vibration data collection – choice of measuring point
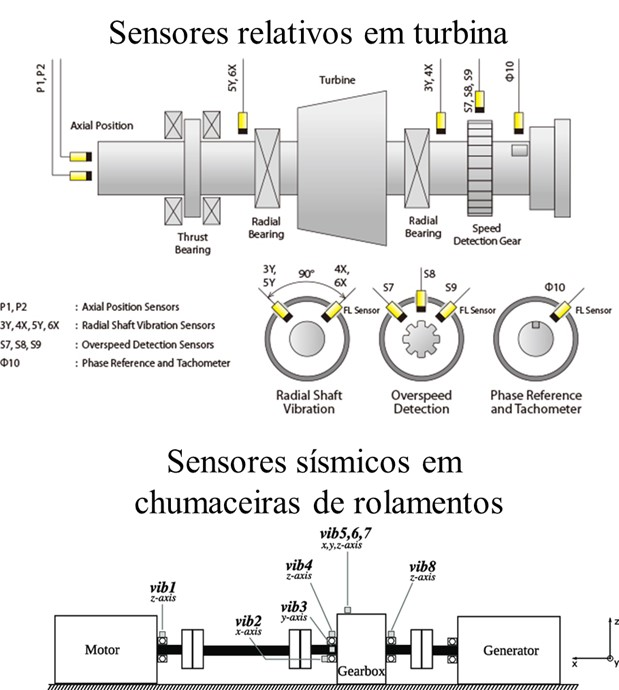
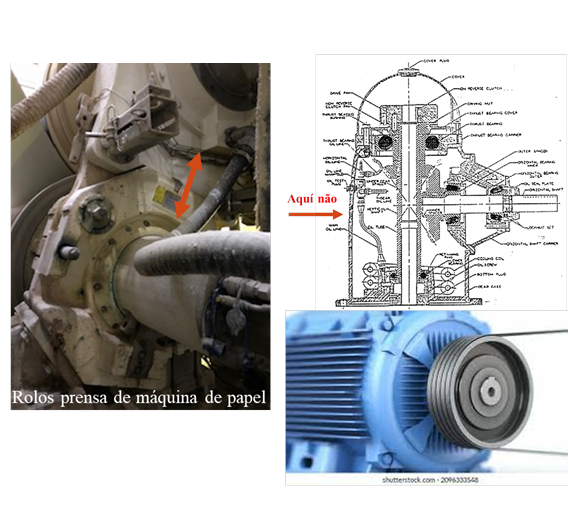
The key to accurately measuring vibration, is the placement of the transducer at a point where a good response to the condition of the machine is obtained. In any case, the transducer should be placed as close, physically possible, of the bearing. The following figure shows the optimal mounting points for transducers for data collection..

Horizontal and vertical positions are shown relative to the bearing centerline.. These locations are used to sense vibrations from radial forces such as mass imbalance.. Vibrations of axially directed forces are measured in the axial direction, in the loading zone. In the figure, the weight of the rotor causes the load zone to be at six o'clock.
The transducer should be placed as close as possible to the bearing, nevertheless placement is limited by components such as boxes, coupling covers, and guards two fans. The previous figure shows recommended locations for placing transducers on a typical machine.. In complex housings, details of the internal design are needed to determine the type of bearing and the optimal path for mechanical signal transmission.. When bearings are inaccessible, transducers can be mounted and connected to a junction box to allow uninterrupted access to the measurement point.
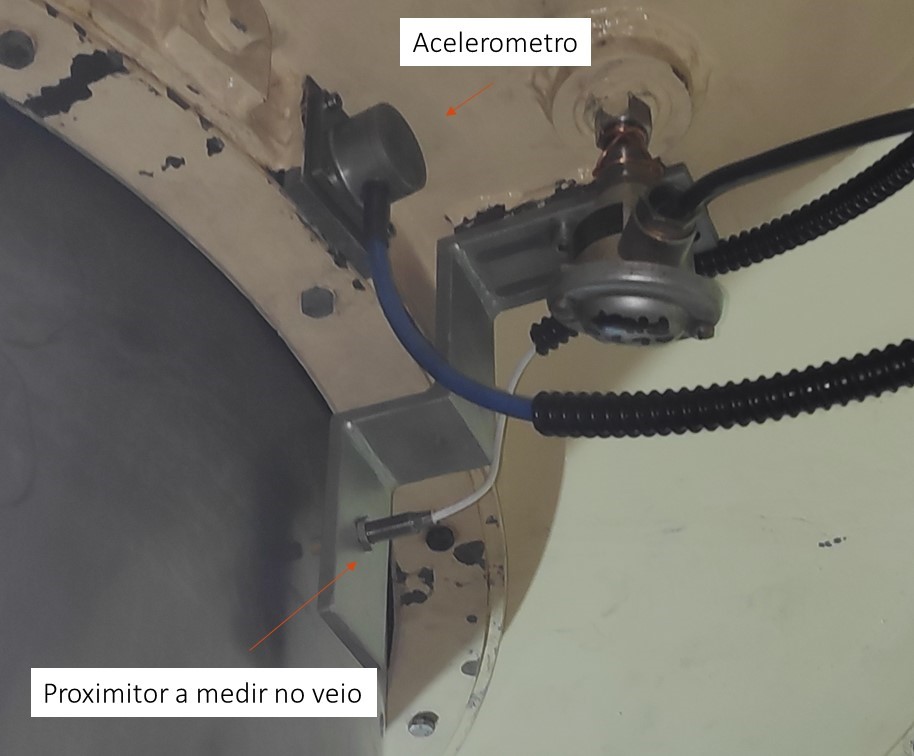
Below you can see accelerometers mounted on a bearing of a machine.
Below you can see a video with a practical example of the influence of the measurement point on the results of vibration measurement.
The internal diametrical clearance existing in heavily loaded low speed bearings – normally ball bearings – allows the inner ring/rolling element/outer ring to contact only in the load zone of the assembly.
In general, Radial readings are taken on radial bearings; that is, any anti-friction bearing with a contact angle of 0°. Radial bearings are used in electric motors, in fans, and in power transmission units not subject to axial load.
Angular contact bearings or any thrust absorbing bearing have a radial/axial coupling, that requires an axial measurement for accurate condition monitoring. other gears, beyond spur gears, absorb impulses and should be measured in the axial direction. Radial measurements are required to ascertain conditions at operating speed (1x) such as imbalance, misalignment, I desaperto, resonance, and it came warped.
Vibration data collection – Frequency Intervals
Spectrum can be collected as part of the detection function on most data collectors. Frequency ranges must properly reflect the sample. And the appropriate transducer must be selected. Waveform clipping may occur when the spectrum range is less than the maximum frequency to be transmitted. Table B contains recommended frequency ranges for spectrum taken from rotating machinery for monitoring and analysis.. Ranges are based on RPM and other machine frequencies. Waveform clipping in the frequency range is indicated by spectral energy values that are significantly lower than overall levels..
Yet, if the spectrum range is wide, resolution can be reduced to the point where discrete frequency information is not available. If adequate resolution is not available from the default frequency ranges, multiple data samples must be collected and analyzed. An optimal setting allows enough resolution to analyze frequency and operating speed sidebands as well as range to measure higher bearing or meshing frequencies. It is desirable to separate the data point into two or three intervals or increase the resolution lines for better resolution.. Therefore, multiple data collection cycles may be required on the same test point or the data collector must be able to process data at multiple intervals from a single sample.
Presentation of the data
Vibration data from a machine running at constant operating speed is generally repetitive.. Small variations occur as a result of the influence of load, from temperature, and the process. Environmental conditions and load should be noted when data are collected.. Data is normally shown in the spectrum, wave shape, and orbit.
Vibration data collection – Wave shape
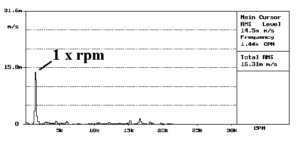
The waveform is a plot of vibration amplitude versus time.. The behavior of the machine is reflected in the vibration signal.. A waveform and spectrum are shown below..
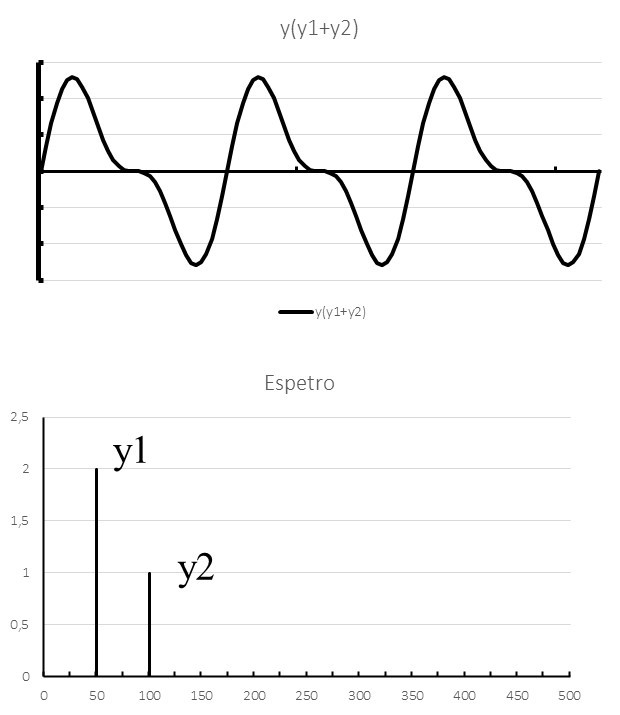
The figure has a waveform with a 3t screen (1,080/3 = 0,36 sec = t; time interval = 1,08 sec.
The waveform is useful in identifying unique events on a machine and the rate at which they repeat.. The duration (in seconds) of the data screen from the waveform depends on the information sought. It is typically related to the period of operation of the machine t; t in seconds equals 60/RPM. The best phase angle resolution for basic balancing is obtained by using the fundamental period t on the screen.
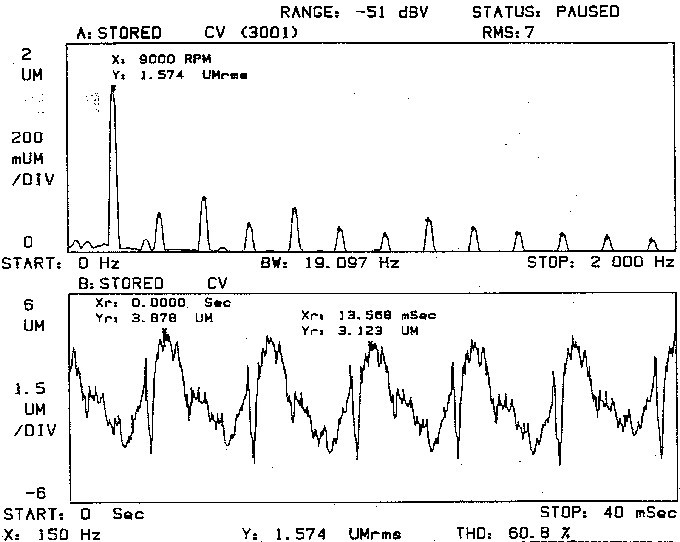
In the figure the shape of the waveform with a 6t screen (40 ms not screen /6,66 ms fundamental period).
Vibration data collection – Spectrum
Spectrum regulation is determined by the frequency range of the data so that all information is obtained.
In such a situation, if necessary, the frequency range and better resolution should be processed two or more spectra in different frequency ranges. With a data logger the analyst has the option of increasing lines of resolution instead of taking more spectra..
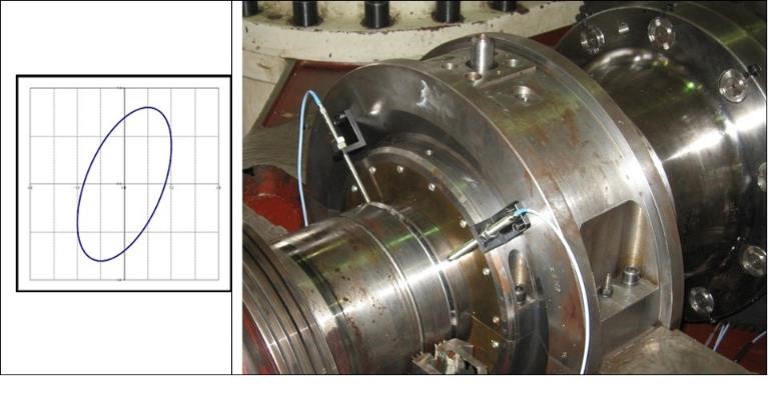
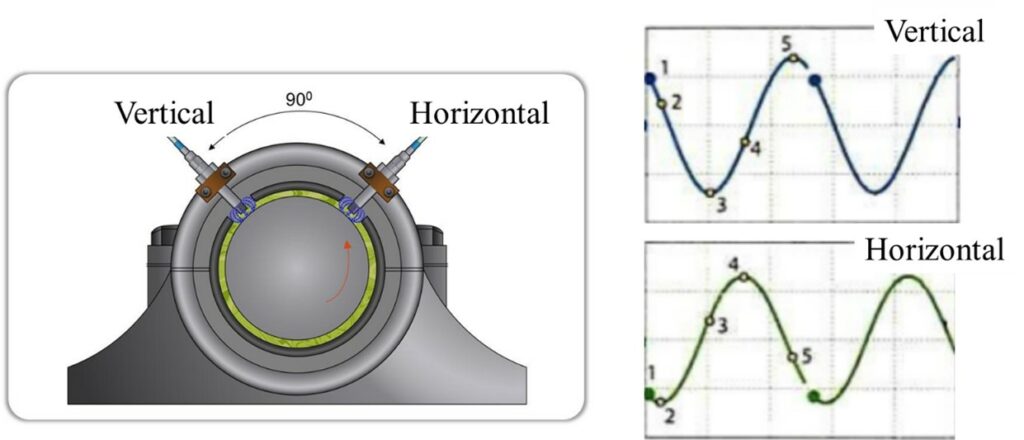
Vibration data collection – Orbit
The orbit shown in the following figure is a two-dimensional representation of the vibration, at a point of the machine. Orbits are normally gathered from proximity sensors, which show the physical movement of the shaft relative to the support. Orbits are useful showing the movements of pedestals, pipes or any structure when a better visualization of the vibrating object is required.