Turbomachines and orbits
The subject treated in this article consists of turbomachines and orbits.
This article belongs to a series, which constitutes the support material for the course on vibration analysis in turbomachinery. Links to the other articles can be found on here.
1 Turbomachines and orbits – construction of the Orbit
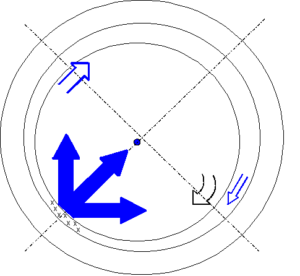
The orbit combines the data present in the waveforms of a pair of proximity sensors, 90º out of phase, in a bearing. This creates a graph that displays the movement of the center of the shaft, to two dimensions. In the orbit of the figure the sensors are placed at 0° and 90°.
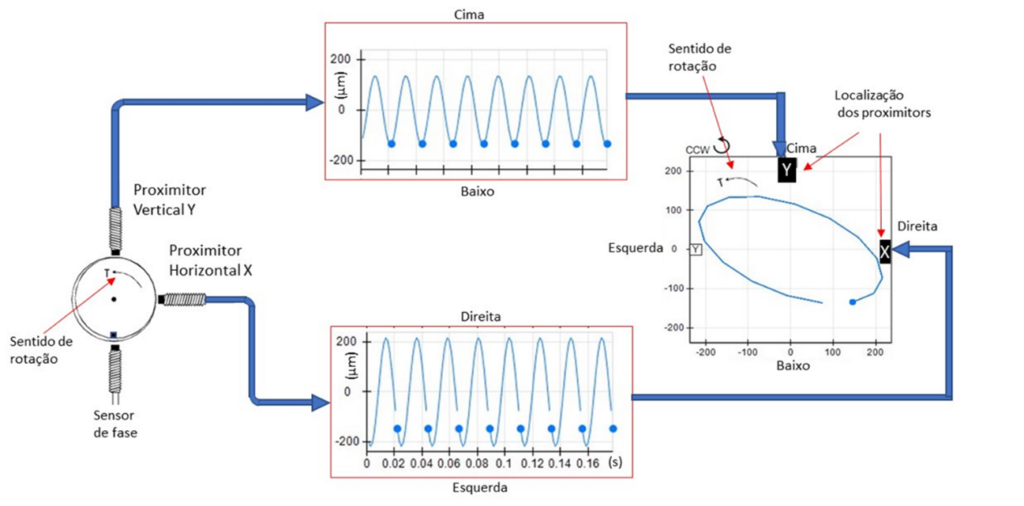
Figure – Orbit resulting from the pair of XY displacement sensors
In orbit, a point is defined by a pair of X and Y values, that is obtained through the information contained in the signals in time.
The center of the graph is defined by the average of the X and Y values of the two waveforms.
An impulse emitted by phase sensor acts as a reference: the black dot shows the location of the center of the shaft when this impulse occurs.
To complete the graph, the location of the sensors and the direction of rotation of the shaft are shown in the previous figure.
Rotation sense
Note that the direction of rotation of the shaft cannot be determined from the orbit without additional information. The best way to determine the direction of rotation is to examine the machine. Another option is to use orbits in slow rotation, which act in the direction of the precession movement.
Like this, knowing that the machine is in slow rotation, allows to determine the direction of rotation observing the direction of precession.
The direction of precession is also determined by the sequence space/blue circle of the figure's orbit.
Below you can see a video on this topic..
The phase sensor mark
Phase sensor mark is blue circle on waveforms and orbit. For example, it can be seen that the maximum of the vertical sensor waveform, he comes 180 degrees past the phase sensor mark, of the blue circle.
The point where the shaft is closest to the sensor
In the previous figure, a vibration cycle is represented on the orbit graph. The positive peak of the signal over time always represents the closest approximation of the shaft to the associated sensor. On the contrary, the negative peak means the greatest distance
Sensor mounting orientation conventions
There are several conventions for entering sensor orientation: EU, Math, US e Vibration Institute.
These conventions allow the same sensor mounting angle information to be entered, because each convention specifies the absolute physical orientation of the sensor in degrees (°) or radians relative to the machine's fixed datum. This allows individual sensor orientations to be known and the relationship (orientation angle) between different sensors to be presented. This is particularly important for any two-channel measurement., where the sensors are mounted at 90° to each other.
sensor orientation – UE
According to the EU convention (or Vibrocam), 0° corresponds to 12 hours (TDC). Other angles are measured relative to this angle using a direction component (negative “-” or positive “+”).
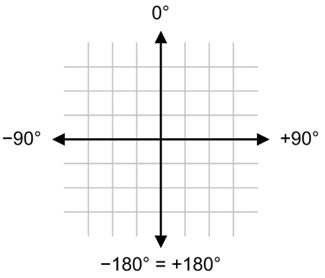
sensor orientation – Mathematics
According to the Math convention (for math), a Cartesian coordinate system is used, where 0° corresponds to 3 hours. The other angles are measured counterclockwise relative to this angle.
sensor orientation – USA
According to the US convention (ou Bently Nevada™), 0° corresponds to 12 hours (TDC, top dead center). Other angles are measured relative to this angle using a direction component (“L” left or “R” right).

Orientation according to the convention of the Vibration Institute
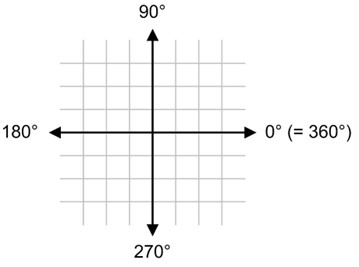
The horizontal sensor is always 90º to the right of the vertical sensor, when looking at the drive side of the machine (vibration institute convention). Note that the horizontal vibration precedes the vertical by 90°, for one spindle rotation, counterclockwise.
Figure – Proximity probe measurement convention. The horizontal sensor is always 90º to the right, do sensor vertical, when looking at the drive side of the machine
The locations of the sensors are indicated at the ends of the graphs, which provides a uniform visual reference, regardless of the mounting orientation of the sensors.
2 Turbomachines and orbits – Filtered and unfiltered orbits
As filtered orbits are not constructed directly from the waveform pair information. The time signal collected by the sensors is filtered at a certain frequency and later used for the construction of the filtered orbit.
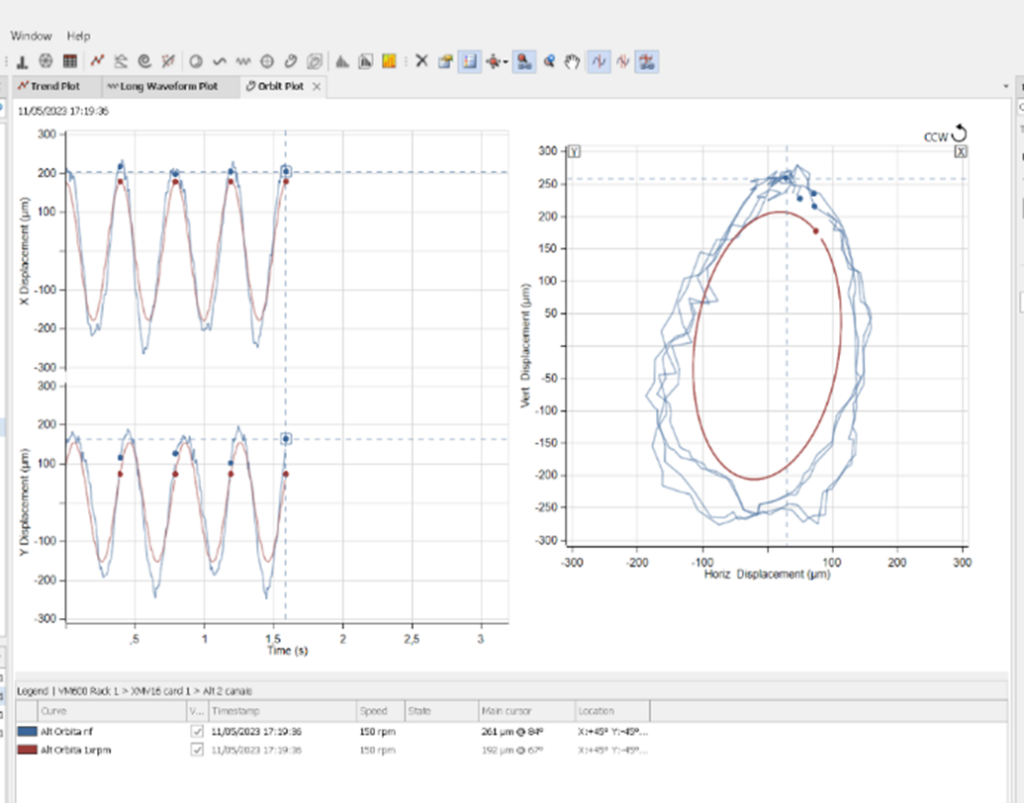
Figure – Filtered Orbits (red) and unfiltered (azul)
3 The phase and rotational speed reference – Phase sensor (keyphasor)
The space / orbit point sequence represents the effect of the phase sensor. This impulse represents an event in time that occurs once per rotation of the shaft. The signal comes from a particular proximity sensor that is placed radially in a different axial position.
The impulse of the phase sensor allows you to indicate the location of the center of the shaft at the moment when, the notch produced on the shaft for the purpose, passes through this sensor during rotation. The space / point sequence indicates the direction of time increment.
In filtered orbits the nX the rotation speed, in which n it is an integer, successive points will be inserted in the graph phase sensor, that will overlap each other. The point of phase sensor adds information that is useful for determining the instantaneous direction of movement of the shaft and for estimating the absolute phase, the frequency of vibration in orders of the speed of rotation and, by last, the rotor vibration mode.
4 Turbomachines and orbits – Information present in the Orbits
The clock, especially be endowed with phase sensor, can be used to measure peak-to-peak amplitude in any radial direction, the relative frequency of the vibration or the direction of precession.
The orbit profile can provide important clues about the machines' behavior, highlight changes in the response that would have been traditionally unnoticeable, and help identify the location where the problem may occur in relation to the position of the machine components. The orbit displays the path of the shaft relative to the average position, there is no information about the average position of the shaft. To obtain the average position of the shaft, there are other types of graphics.
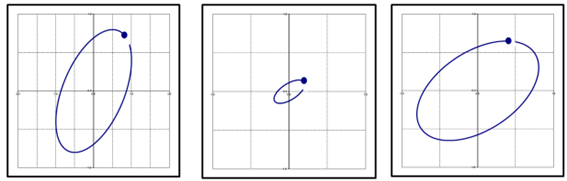
Orbit charts can be created from the same location and at different speeds (transient data), to show the evolution of shaft vibration with increasing speed.

Figure - Corbitt – The orbit at different rotational speeds and you can see the increase in the level of vibrations with the increase in speed
In the following video you can see the evolution of the filtered orbit, during the test of a turbomachine.
Video
On the other hand, orbits can be created from different axial locations and at the same speed, to display the vibration mode of the shaft.
5 – Turbomachines and orbits – The peak-to-peak measurement in orbit
One measurement that can be performed in an orbit is the peak-to-peak amplitude..
There are two fundamental aspects when using this measurement.
- First, peak-to-peak measurement needs to be done parallel to the sensor's measurement axis. Simply measure vertically or horizontally, in this case, would produce different and incorrect results.
- Second, peak-to-peak measurement is made between tangents that are also perpendicular to the sensor's measurement axis.
The primary quantities of interest, in vibration measurements on a shaft, are the variables that describe the shape of the orbit. Consider the orbit of the shaft shown in the following figure., assuming there are two transducers A and B, mounted at 90º to each other, which are used to measure shaft vibration.
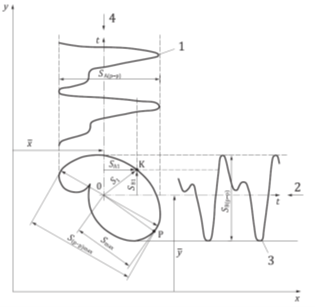
Legend
| 1 | transducer waveform A |
| 2 | transducer A |
| 3 | B transducer waveform |
| 4 | transducer B |
| x, Y | fixed reference axes |
| 0 | time-integrated mean position of the orbit |
| he | time-integrated mean values of shaft displacement |
| K | spindle center instant position |
| P | shaft position, for the maximum displacement from the time-integrated mean position |
| S1 | instantaneous value of shaft displacement |
| Smax | maximum value of shaft displacement from mid position 0 integrated in time |
| SA1, SB1 | instantaneous values of shaft displacement in the directions of transducers A and B respectively |
| S(p–p)max | maximum peak-to-peak shift value |
| SA(p–p), SB(p–p) | peak-to-peak values of shaft displacement in transducer directions A and B |
| USE | In this illustrative scheme SA(p–p) = S(p–p) viewSA(p–p) > SB(p–p) |
Figure — Definition of shaft displacement magnitudes according to the ISO20816
in a given moment, the center of the shaft will be coincident with the K point on the orbit, and the corresponding instantaneous value of the shaft displacement from the middle position will be S1. Yet, in the direction of the transducers, A e B, the instantaneous values of the displacement of the shaft from the middle position will be SA1 e SB1, respectively. The relationship between these quantities is given by the following formula:

The values of S1, SA1 e SB1 vary with time, as the center of the shaft moves around the orbit; the waveforms measured by each transducer, are shown in the previous figure..
USE – It orbits for elliptical, so these waveforms are pure sinusoidal of the same frequency.
The peak-to-peak value of the displacement in the transducer A direction, SA(p–p), is defined as the difference between the maximum and minimum displacement of transducer A and similarly for SB of transducer B. clearly the values, SA(p–p) e SB(p–p), will not be equal and, in general, will be different from measurements made in other radial directions. Therefore, the peak-to-peak offset value depends on the measurement direction.
Since these measured quantities are independent of the absolute value of the mean position, it is not necessary to use systems that can measure both average and alternate values.
The peak-to-peak shift, It is the most frequently used quantity for monitoring the vibration of rotating machinery..
While peak-to-peak displacement measurement, in any two given orthogonal directions is a simple matter, the amount and angular position of the maximum peak-to-peak displacement shown in the previous figure is difficult to measure directly. Yet, in practice, it was considered acceptable to use alternative measurement quantities, that allow to obtain a suitable approximation for the maximum value of peak-to-peak displacement.
For more accurate determinations, it is necessary to examine the vein orbit in more detail, for example, with an oscilloscope.
The three most common methods for obtaining satisfactory approximations are described below..
Method A: Value resulting from peak-to-peak shaft displacement values measured in two orthogonal directions
The value of S(p–p)max can be obtained by approximation of the formula:

Using the formula as an approximation, when the vibration is predominantly at the frequency of rotation, usually overestimates the value of S(p–p)max , with a maximum error of 40%.
The maximum error occurs, for a circular orbit, and progressively shrinks as the orbit becomes flatter, with zero error, in the case of a deformed orbit, in a straight line.
Method B: Obtaining the peak peak-to-peak shaft displacement value from the measured values in two orthogonal directions.
The value of S(p–p)max can be obtained by approximation of the following formula:

whatever the biggest.
Using the above formula, as an approximation when the vibration is predominantly at the rotational frequency, usually underestimate the value of S(p–p)max, with a maximum error of approx. 30%.
The maximum error occurs when the orbit is flat and progressively reduces its value as the orbit becomes circular., with zero error when the orbit is fully circular.
Method C: measurement of Smax
The instantaneous value of the shaft displacement can be defined by S1, as shown in the previous, which is derived from the measurements of the transducer SA1 e SB1, using the formula ( ). There is a point on the trajectory, defined by P, in the previous figure, where the displacement from the mean position 0, is maximum. The value of S1 corresponding to this position, is called Smax, which is defined as the maximum displacement value according to the following formula:

The point on the orbit where Smax occurs, does not necessarily coincide with the points where SA1 e SB1, are at their maximum values. Clearly, for a certain path, there is a value of Smax, being independent of the position of the measurement transducers, since the average position 0, do not change.
The value of S(p–p)max can be obtained by approximation using the following formula:

This formula is correct when the two orthogonal measurements, of which Smax It is derived from, are sinusoidal, single frequency. In most cases, this formula overestimates S(p–p)max since this depends on the nature of the harmonic vibration components present.
Note that implicit in the definition of Smax, is the requirement to know the time-integrated average value of the shaft displacement. The measurement of Smax is, therefore, limited to measurement systems that can measure average and alternate values. Besides that, S's ratingmax, from the signals produced by two vibration transducers, is a relatively complex mathematical procedure, that requires specialized instrumentation.
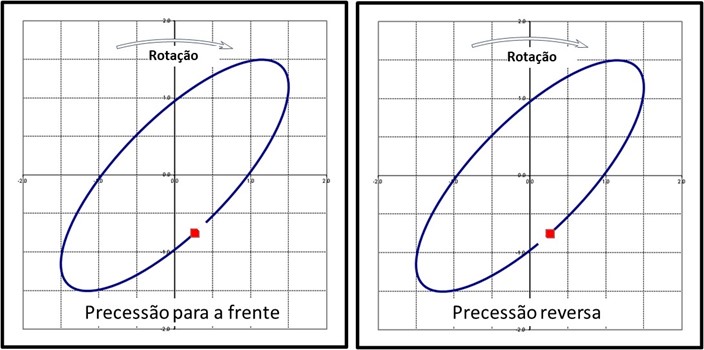
6 Turbomachines and orbits – the sense of precession
The orbit is used to determine the direction of shaft precession. In other words, the direction of rotation of the orbit may be opposite to the direction of rotation of the shaft.
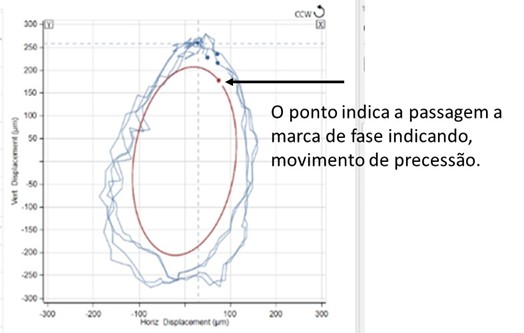
The point of phase sensor indicates the direction of time increase, sense that will be the precession of the vein. Once determined, the direction of precession can be compared to the direction of rotation to confirm that we are facing precession to face (coinciding direction of rotation and precession) or back (sense of precession contrary to rotation).
In complex orbits, the shaft can be precessed forward for one part and precessed backward for the remainder of the orbit.
Forward precession is the most frequently observed vibration. The orbit described by the center of the shaft rotates in the same direction as the rotation. Reverse precession occurs with the orbit described by the center of the shaft rotating in the opposite direction of rotation.. This can happen during friction between the shaft and the bearing., for example, or between multiple critical speeds.
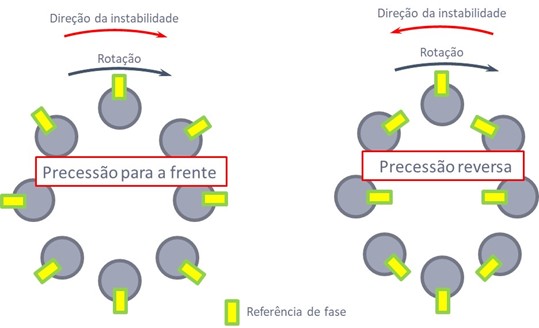
Precession from phase reference
The normal "space-ball" convention indicates forward precession. phase marks “she was – space” indicate reverse precession. To identify this, always check the orientation of the probe and the direction of rotation.!
The phase of various signal components
The filtered orbit can be used to estimate the absolute phase of the two components of the signal.
This estimate will be more accurate for circular orbits, and less accurate for elliptical orbits due to the movement at constant angular velocity of the circular orbit along its path (equal time intervals and similar angles between points).
In elliptical orbits, the angular velocity of the orbit is not constant (equal time intervals, but different angles between points). Since the phase is a measure of time, these variations in angular velocity cause inaccuracies when trying to estimate the phase with respect to each sensor.
7 Turbomachines and orbits – Operational deflection form
The following figure illustrates a set of 1X rotational speed orbits at which the phase sensor indicate the location of the center of the shaft, in each measurement plan, the moment the impulse occurs. These points can be connected to each other by a line, in order to obtain an estimate of what the behavior of the shaft will be along its length.
The shaft movement occurs at different rates in different parts of the orbit. No additional indications, the location of the shaft is not known at any given time.
The impulse of the phase sensor is the solution, providing the reference in time for a point, in particular, in each orbit.

Figure – In each orbit, the impulse of phase sensor displays the location of that point on the shaft
8 Turbomachines and orbits – presentation of the Orbit associated with the signal waves in time
This type of graph combines the orbit with two waveforms of the signal in time. The waveform resulting from the Y reading is displayed below the X, both to the left of orbit, as seen in the figure below.
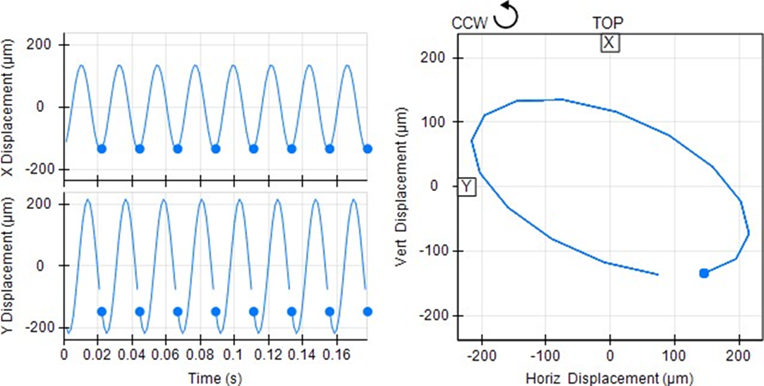
The graph contains information about the direction of rotation, the velocity, the scale used in orbit and the time scale present in the waveforms.
The following figure is an example of how to use these graphs to locate a defect on the shaft surface.. This orbit has a shape that reveals damage to the surface of the vein.. Normally, surface defects are reflected by peaks that point in the direction of the sensors. The waveforms help to clarify the period between these peaks and make it possible to determine the angular location of the surface damage..
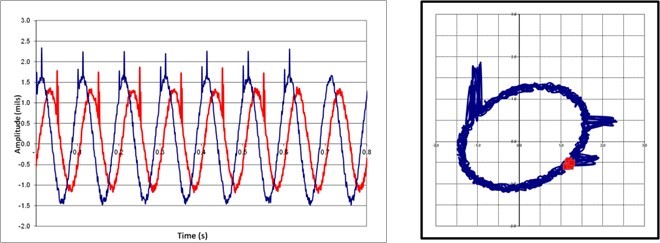
Figure – Orbit associated with the Y and X waveforms showing the existence of a defect on the shaft surface
Remember that the positive peaks of the waveform represent the passage of the shaft next to the sensor and that, the mounting location of the sensors, is displayed on the orbit graph. The impulse of the phase sensor represents the same instant in all graphs. This combination of graphs makes it possible to correlate the information present in the orbit with the information of the waveforms.
9 Turbomachines and orbits – Orbit vector offset
Compensation allows you to mathematically remove any unwanted information from an orbit plot. The 1X filtered orbits can be vector compensated to subtract the slow rotation runout vectors from each probe. That's how you have:
1X Orbit – 1X Orbit Vector in slow rotation = 1X Compensated Orbit
The run-out compensation on the Orbit wave
The run-out compensation in the waveform, can be used to eliminate “bumps” in orbit data caused by surface lode defects, in the target areas of the probe. A waveform obtained from slowly rotating shaft measurements, when there are no vibrations, is digitally subtracted from the vibration waveform data, using trigger as reference. The resulting waveform includes the actual shaft vibration and any noise in the unfiltered waveforms of the signal..
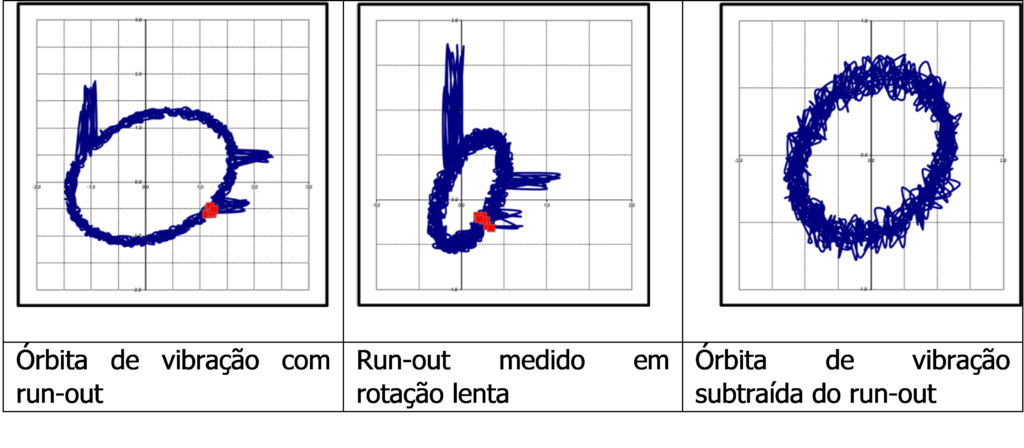
Figure – The run-out compensation
When not to use run-out compensation on the Orbit wave
If a rotor is too bent and stiff enough, the shaft pivot path can trace a circle or a flat ellipse on the shaft centerline graph, even in slow rotation, no spinner. For this reason (among others), it is highly recommended not to use runout subtraction when performing vibration data analysis or even for in-shop rotor balancing. The deviation vector subtraction was thought to “to clean” the dynamic signs of the surface irregularities of the journal, but if the deviation vector is an indication of eccentricity, it serves to remove the best indication of mass eccentricity, which is often the root cause of an observed vibration issue.
10 Turbomachines and orbits – the shapes of the orbits
Turbomachines and orbits – Imbalance
The diagnosis of imbalance is carried out in the synchronous amplitude that coincides with the rotor speed. This can be done by viewing the spectra of any proximitor.. A similar diagnosis can be made by viewing the filtered signals from two proximitors mounted orthogonally as orbits.. As the equilibrium condition deteriorates, the size and, sometimes, the shape of the orbit will increase until the peak-to-peak amplitude exceeds acceptable limits.

Turbomachines and orbits – split shaft
A crack in a rotor, or came, can generate several different effects on the behavior of the machine:
- change in vibration level;
- phase angle changes;
- and/or a change in resonant frequency when the machine starts or stops.
Spectral analysis can be used to identify this fault., but observing synchronous and filtered orbits with the phase angle superimposed on the orbit allows a quick identification of this condition
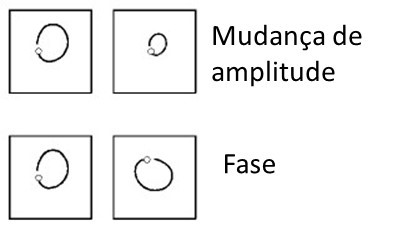
Using the orbits, changes in the filtered amplitude can be determined.. By superimposing the phase angle input signal on the orbit, a change in this parameter can be easily determined. By observing the operating speed at which resonant frequencies occur, a change in this frequency may indicate the “possibility” of a crack.
A “possibility” must be emphasized and analyzed carefully, because many other causes can produce these changes, such as damaged or loose bearing bracket, foundation problems, loose rotating parts. In other words, basically everything that can influence the mass of the “system”, damping and/or stiffness
Turbomachines and orbits – loose rotating part
A loose rotating part, may generate unusual vibration signals. They can fluctuate in amplitude and the phase angle can also change.. This fault is most easily diagnosed using synchronous and filtered orbit analysis. imagine a mass, like an impeller, that got loose; it can rotate freely on the axis independently.
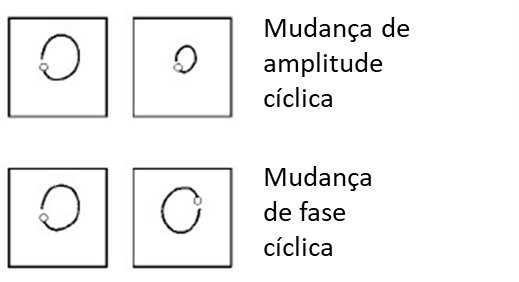
As the loose part rotates, it influences the balance condition of the rotor, which appears as a cyclic increase and decrease in synchronous amplitude. This is observable using a spectrum analyzer, but changes can be too fast for the instrument's sample rate. An oscilloscope set up to observe a filtered orbit will continuously sample so changes can be seen..
Orbit will appear to vibrate slightly when this condition is created; the part may be slipping and then gripping the shaft just before becoming a completely loose rotating part.
Turbomachines and orbits – Oil film instability (oil whirl)
Oil film instability and oil whip (oil whip) are sometimes listed as a single machine failure, but a closer look at the vibration signals and the machine conditions that cause those signals will produce different and distinct signal displays for each condition..
This fault is caused by a condition that prevents the rotor from creating an oil wedge., stable on which it slides.

An improperly designed bearing is the usual source of oil slurry conditions., but a change in fluid viscosity or machine alignment status, are other possibilities.
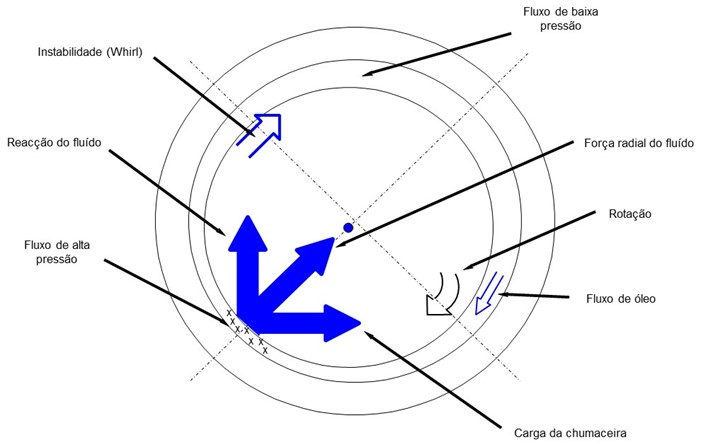
Usually, an oil film instability condition precedes an oil whip condition. Spectral and orbit analysis can be used to identify any condition. This phenomenon creates an individual subsynchronous frequency that can occur within a frequency range of 35% a 48% of rotor speed, depending on machine/bearing design or construction. As the machine accelerates, turning frequency increases as machine speed increases.
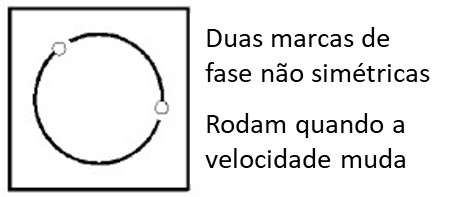
Observing oil film instability as a synchronous and filtered orbit yields a different presentation.. The orbit will be more or less round in shape with a breadth approximating the bearing clearance and, when the phase angle is superimposed on the graph, the orbit will appear to have two phase marks. This feature is due to the filtering at the spindle speed and fault generation at a subsynchronous frequency.. The two phase marks will not display symmetrically on the orbit because the frequency of the jitter is not exactly at the machine speed.
The regular flow of oil into the gap between the shaft journal and the anti-friction metal is the most favorable condition for creating instability..
Below you can see some types of bearings that break the regular flow of the oil film.

Turbomachines and orbits – Oil whip
Oil whip occurs during the later stages of an oil film instability condition and has a distinct orbital display.

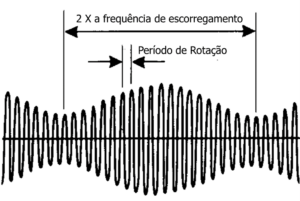
Whip can occur if a machine runs at speeds greater than 2X the critical spindle speed. When spindle accelerates to 2X critical speed, excessive vibration will prevent the oil film from supporting the shaft. The Whirl's speed will lock to the critical speed and, when the machine rotation speed increases, the whip frequency will not increase. This can be easily seen in a espetral map performed by a vibration analyzer.
Under these conditions the orbit, with phase input superimposed, seems to have several phase marks. This display will be round in shape and the amplitude will be greater than the observed amplitude during oil film instability.
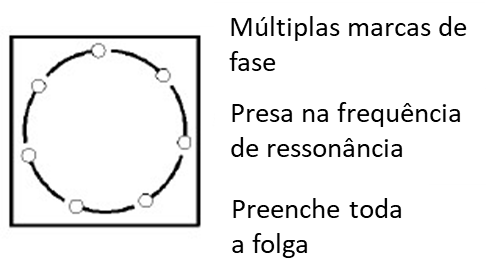
The orbit size will be larger because the shaft takes up all of the bearing clearance, as an oil wedge can no longer be established by the rotor and the shaft is in direct metal-to-metal contact, with the bearing. The orbit display will no longer rotate because the oil swirl frequency coincided with the first natural resonance, or critical speed, e “it locked” on this frequency. Oil whip is a dangerous condition because the rotor uses all of the bearing clearance and is in direct metal-to-metal contact which will wear the bearing quickly and destroy the rotor if not corrected..
Turbomachines and orbits – excessive preload
All machines with oil film bearings have some amount of preload so that a stable oil wedge can be established.. Preload can be produced internally or externally. Internal sources of preloads are from gears or hydraulic loads, during pumping actions. External preloads can come from misalignment coupling or expansions in the piping and support system. These precharge sources create an elliptical orbit that is flattened in the direction of the precharge vector.
As the preload increases, the orbit is flattened. As the excessive preload increases further, the orbit begins to collapse to form a shape of “banana” while the shaft tries to continue its normal pattern and direction of rotation.
After the orbit is flattened into the shape of “banana”, appears in the spectrum a frequency at 2X. Stronger preloads further distort the figure-eight orbit. As the preload increases, the shaft centerline shifts in the direction of the preload vector.
Turbomachines and orbits – Friction
A common problem with newly rebuilt or modified rotors is slight rubbing when the rotor is initially operated.. Rotor friction is not a phenomenon that continues for an extended period. This phenomenon generally increases clearances until friction is eliminated or, if not fixed, will wear out the internal clearances until the machine cannot be operated. The shape of the orbit will be different depending on the relationship of the shaft velocity to the first natural frequency and the severity of the friction..
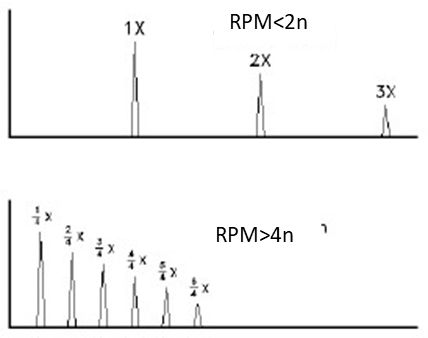
The spectra of frictional conditions are characterized by several distinct frequencies that occur in multiples of the speed of rotation.. The fundamental frequency will depend on the relation of the shaft speed to the first natural frequency.. At spindle speeds up to twice the natural frequency, the frequency will match the spindle speed with multiples of 2X, 3X, etc. Between two and three times the first natural frequency, frequencies are generated at spindle speed, with multiples in 1X, 3/2X, 2X, 5/2X, etc. Between three and four times the natural frequency, the generated frequencies will be at the spindle speed with multiples in 2/3X, 1X, 4/3X, 5/3X, 2X, 7/3X, etc.
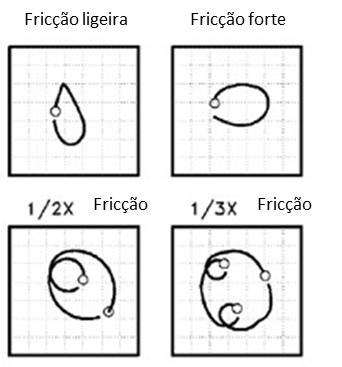
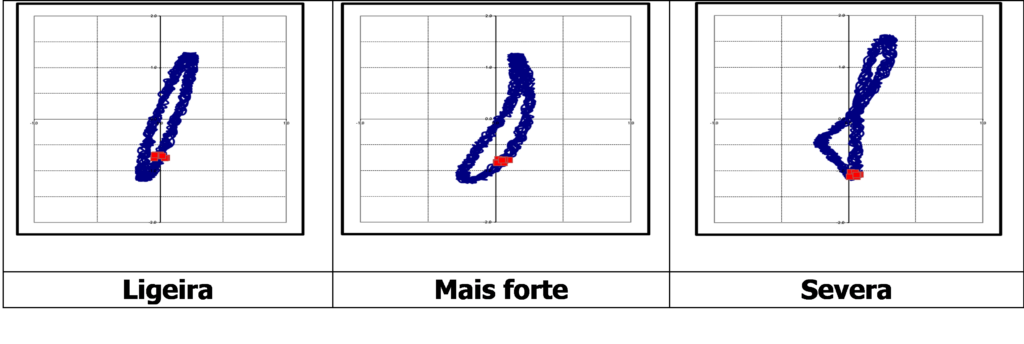
The gravity of the friction will affect the shape of the orbit. Slight rubbing will produce an orbit in the shape of a “tear drop”, with the point of the teardrop coinciding with the point of impact. As the friction gets stronger, the orbit flattens and may appear as excessive preload.
At higher machine speeds (above twice the first natural frequency), unfiltered orbits will start to loop (loops) internals with the fundamental friction frequency inversely proportional to the number of internal turns. These inner loops will have their own phase marks displayed and the loops will be located symmetrically on the graph..
Turbomachines and orbits – Turns in Orbits and the sense of precession
Loops in the Orbits indicate the presence of non-synchronous vibration. The outer loops are caused by the dominant precession of the non-synchronous components.. Internal loops are caused by the dominant reverse precession of non-synchronous components.