Vibration analyzer 2 – Sampling and scanning
Then, on vibration analyzer 2, we introduce the theme of sampling and digitization, in a vibration analyzer when performing measuring vibrations. Like this, this article is part of a series that explains how a vibration analyzer works.
De facto, when we carry out the Vibration Analysis, we need to understand how an analyzer works. Therefore, here we present the concepts of digital signal analysis, implemented in an FFT analyzer. In order to be easy to understand, are always presented from the user's point of view, in a vibration analyzer when performing predictive maintenance.
Then, no link, we can see a range of Vibration analyzers provided by D4VIB.
Then, on vibration analyzer 2, we present the content of this series of articles.
- What is the relationship between time and frequency
- How sampling and scanning works
- What Aliasing is and what effects it has
- How it is used and what the zoom consists of
- How waveform windows are used
- What are averages for
- What is real-time bandwidth
- What overlay processing is for (“overlap”)
- What is order tracking
- What is envelope analysis
- The two-channel functions in the frequency domain
- What Orbit is for
- What are the functions of a channel in the time domain
- What the Cepstro consists of
- What are the units and scales of the spectrum
2 – Sampling and scanning on a vibration analyzer
2.1 How scanning is performed on the analog-to-digital converter (ADC)?
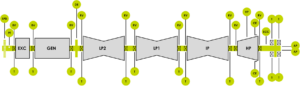
As already mentioned, the input to a Vibration Analyzer is an electrical signal generated by the vibration sensor. On the other hand, for calculations, the FFT requires digitized samples. In other words, FFT is calculated based on numbers. Therefore, an ADC is required to sample the waveform. Then, the processor calculates the FFT spectrum.

Figure 2.1 – As mentioned, here you can see the ADC in a block diagram of an analyzer.
Above all, it is very important that the ADC does not introduce errors.

Figure 2.2 – It is very important that the ADC does not introduce errors.
2.2 Sampling and scanning – What the dynamic range is and what it is for?
First, it should be noted that the dynamic range is the characteristic that allows analyzing small signals in the presence of large ones..
De facto, when we see a spectrum and we refer to the noise (weapon), we are seeing the dynamic range effect. Similarly, this is the relationship is between the largest and smallest sign, that can be measured at the same time.

2.3 How important is dynamic range in sampling and scanning?
Due to this, vibration analyzers have a large dynamic range. Like this, nowadays, most analyzers are able to display signals for 1000, or more. For this reason, sometimes we use logarithmic scales to take advantage of this ability.
actually, to analyze very small vibration signals, having a large dynamic range is very important.. For example, are in this case, the first symptoms of bearing failures, in the presence of large components such as, for example, an imbalance.
Likewise, the dynamic range is also important when the component of the frequency spectrum to be analyzed is small, compared to the global level. De facto, this global level limits the sensitivity to entry, in the same way as a single large signal. actually, When, with an accelerometer we measure a low frequency vibration, this situation is frequent.
2.4 What does dynamic range depend on in sampling and scanning?
In fact, the dynamic range of a measuring equipment, is the result of the characteristics of a series of components:
- ADC resolution (number of bits, linearity etc.),
- Noise from the input amplifier,
- Features of the anti-aliasing filter,
- Electrical noise inside the analyzer,
- The capacity of the FFT calculation processor,
- etc.
It is also worth noting that, take into account that, general rule, the specification is for the worst measurement situations. De facto, the worst measurement situations occur when using the maximum frequency range and the lowest end of the input scale. Like this, typical performance, it's usually better (20 dB is common). This is so, in the frequency range used, for measurements on most machines and reasonable input scaling purposes. So it is important to understand the difference between:
- The specified dynamic range, that is, guaranteed;
- The typical dynamic range, that is, expected under common conditions.
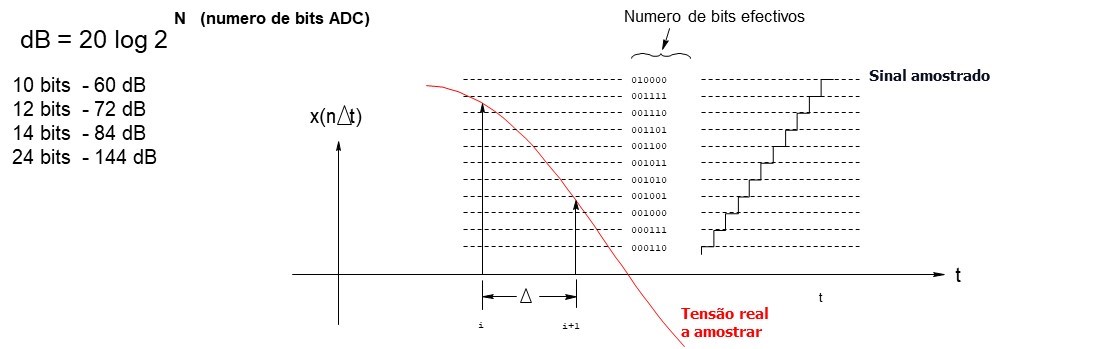
2.5 Sampling and scanning- What is the relationship between the number of bits in the ADC and the dynamic range
Then, we see the relationship between the number of bits in the ADC and the dynamic range in dB.

For example, modern analyzers have a dynamic range in the order of 120 dB.
Due to this, may dispense with the end of scale adjustment function (auto-range). As mentioned, this is due to the fact that they are able to measure the entire measurement range of the most common piezoelectric accelerometers. It is known that in the most common accelerometers, the dynamic range is about 110 dB.
For example, in the vibration analyzer ADASH VA5, the dynamic range is 120 dB. On the same equipment, the number of bits is 24.

Below is a video explaining the importance of the number of bits in a vibration analyzer.