Then, on vibration analyzer 3, we introduce the theme of Aliasing, in a vibration analyzer when performing measuring vibrations. Like this, this article is part of a series of articles that explain how a vibration analyzer works.
In fact, when we carry out the Vibration Analysis, we need to understand how an analyzer works. Therefore, here we present the concepts of digital signal analysis, implemented in an FFT analyzer. In order to be easy to understand, are always presented from the user's point of view, in a vibration analyzer when performing predictive maintenance.
Then, no link, in Vibration Analyzer 3, we can see a range of Vibration analyzers provided by D4VIB.
Then, we present the content of this series of articles.
Next we will see that, an FFT analyzer, performs many samples per second. This is effectively so, in order to avoid a problem called aliasing. De facto, aliasing is a potential problem, in a vibration analyzer when performing.
3.1 What is an aliasing data block
Then, let's consider a data logger, so as to see what is aliasing and how it can be avoided.
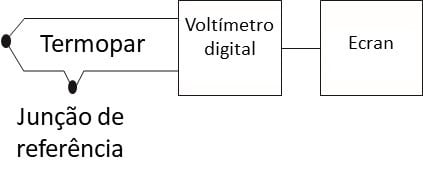
For this, let's see a temperature recorder, like the one in Figure 3.1. Like this, in this measurement system, a thermocouple is connected to a digital voltmeter.
Figure 3.1. As stated, here you can see a measurement system consisting of a thermocouple and a voltmeter.
For example, let us consider that we put this system to measure temperature, once a second.
Like this, if we were taking the temperature of a room, what will we expect?
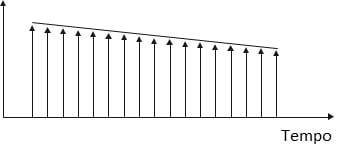
actually, we expect each reading to be almost the same as the previous one. In fact, it is sampling much more often than is necessary. De facto, how do you know, the room temperature varies very slowly.
Like this, in the graph of the results of this “thinking experience”, we expect to see an evolution as in the figure below.
Figure 3.2. As stated, we see a slow descent, in this graph of temperature variation of a room, with time.
3.2 The temperature fluctuation that is not seen in the graph
On the contrary, what would be the evolution of this, if we were measuring it in a small piece?
De facto, this piece, could heat and cool quickly, because it is small,
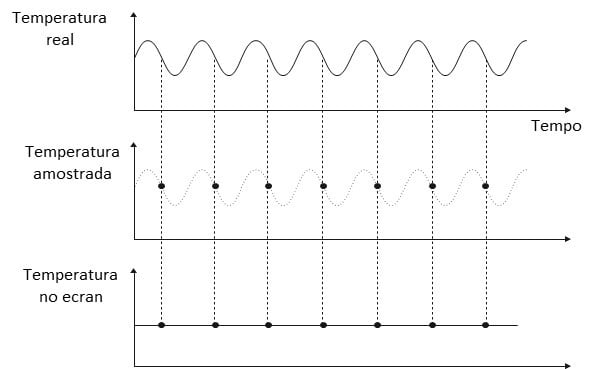
In these circumstances, suppose the temperature of the part oscillated, once every second.
De facto, if a temperature measurement was taken once per second, the graph would show that it never changes.
Figure 3.3. As stated, here you can see the temperature variation graph of a small part.
De facto, what happened is that it was sampled at exactly the same point in the periodic cycle of the part temperature. Like this, in order to see their fluctuations, did not sample quickly enough. In other words, when the sampling frequency is equal to the frequency of the variation, the result is a constant value.
In short, this result, that is wrong, is due to a phenomenon called aliasing.
3.3 The effects of Aliasing seen in frequency
Then, let's see the effect of aliasing in the frequency domain.
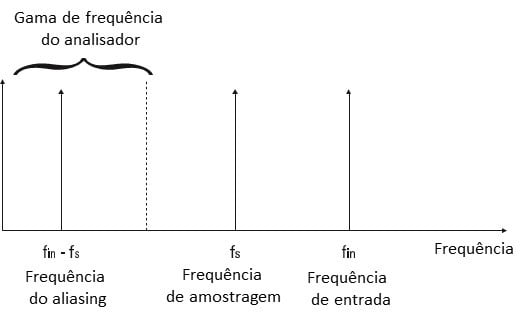
De facto, when aliaising occurs, a new frequency appears. Like this, the value of this frequency is equal to the difference between the sampling rate and the frequency of the sampled signal.
Figure 3.4. – As stated, here you see a component of the spectrum that is not real. In fact, this frequency is due to the aliasing effect.
Like this, we say that a signal is aliasing, if the difference in your maximum frequency and the sampling rate, falls in the frequency range under analysis.
It should be noted that component a to this frequency difference, is generated in the sampling process, no ADC.
In the situation where the input frequency is equal to the sampling frequency, then the aliasing component is zero Hertz.
actually, we saw this in the example of the temperature measurement of a small part. In these circumstances, as we saw before, we have a result that does not vary. In other words, the result is constant.
Like this, how do you avoid aliasing?
3.4 Vibration analyzer 3 – What is the Nyquist criterion
De facto, what happens if the analyzer samples, with a rate greater than double the highest frequency, what are we to measure?
Then, let's see what, in this conditions, the results of the aliasing do not fall within the frequency range under analysis.
De facto, in order to avoid alaiasing we put a low pass filter, before ADC, that removes the high frequency components, that generate aliasing.
So we have to, the condition for an analyzer to show the desired vibration signals, is the following.
the fee ofwaveform sampling must be greater than twice the highest spectrum frequency.
It should be noted that, this minimum sample rate requirement, has the name of Nyquist criterion.
On the contrary, if the sample rate is lower, the aliasing components will fall in the frequency range of the spectrum. As a consequence, if this occurs, there is no filter capable of removing them from the signal.
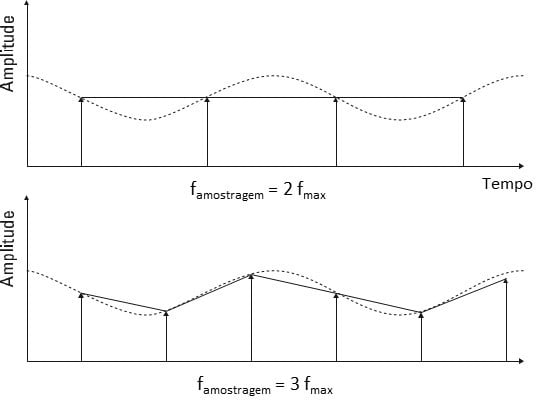
It is worth noting, that to have a well-represented vibration, it is not enough to have a sample rate, exactly twice the input frequency.
Figure 3.4. As stated, it is not enough to have a sampling rate exactly twice the input frequency.
De facto, the waveform is presented with poor quality, when we only have just over two samples in each period.
3.5 Vibration analyzer 3 – Why an anti-aliasing filter is needed (AA)
Unfortunately, the real world rarely restricts the frequency range of vibrations.
actually, in the case of room temperature, already mentioned, we can be sure of the maximum rate at which the temperature changes.
On the contrary, when measuring vibrations we cannot always exclude the occurrence of high frequency signals.
De facto, there is only one way to make sure that the frequency range of the input vibrations does not have high frequencies.
actually, this consists of placing a low pass filter, before ADC. Like this, this has the name of AA filter.
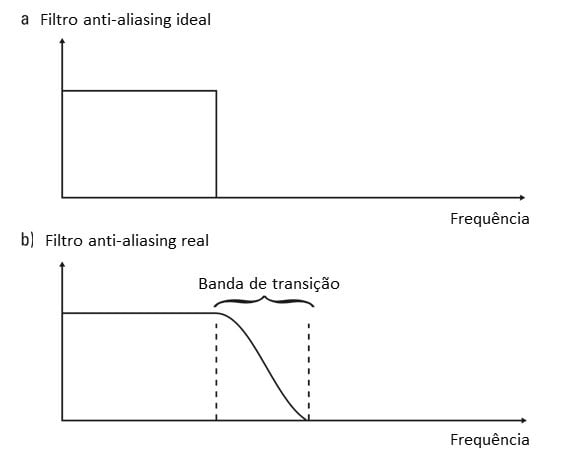
It has to, ideally, a low pass filter, AA, is similar to the one in Figure 3.5 a. De facto, in this conditions, this filter only lets the desired input frequencies pass. On the contrary, all the higher frequencies, are completely rejected.
However, it is not possible to build a filter with this shape.
De facto, instead, all real filters look like the Figure 3.5 b. Then, in the figure, we see how these show a gradual decay. Because of this, have a finite bounce rate, of the frequencies that we don't want.
Figure 3.5. As stated, the actual AA filters, require higher sampling frequencies.
3.6 Vibration analyzer 3 – What is the relationship between the AA filter and the sample rate
In fact what happens if the vibrations you want to measure, are not well attenuated in the transition band?
actually, these frequencies can still generate aliasing in the analysis frequency band.
Like this, to avoid this, in the transition band, the sampling frequency is increased to double the highest frequency, .
Thus, this ensures that, all the vibrations that could generate aliasing, are well attenuated by the filter. Like this, this means that the sample rate is now two and a half to four times, the maximum input frequency.
Therefore, to properly perform an FFT analysis, up to one fmax of 25 kHz, this may require an ADC that works at 100 kHz.
3.7 What is the influence of the anti aliasing filter on the number of lines in the spectrum
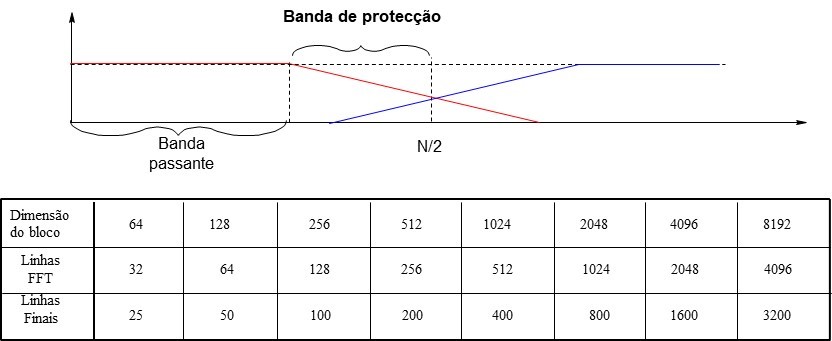
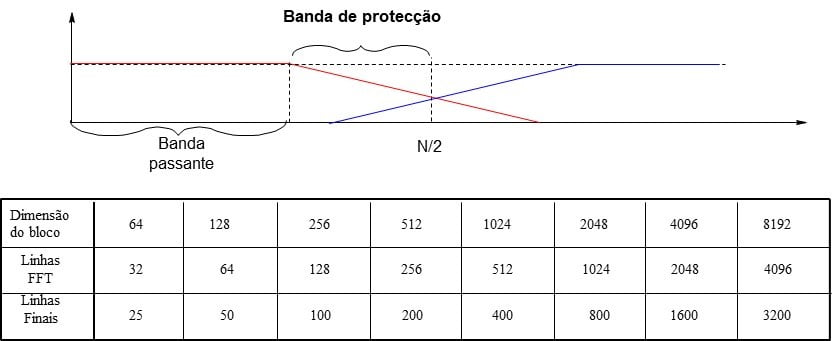
Therefore, to avoid aliasing problems, spectra do not have N / 2 lines (where N is the number of samples in the waveform). De facto, instead of this the spectra have a number of lines between 0,25 N a 0,4 N.
Figure 3.6. As stated, for the spectrum to be protected from aliasing, it is common to remove the latest 22% of lines.
For example, the ADASH VA5 vibration analyzer, has a maximum waveform sampling rate, of 196 KHz. Like this, this corresponds to a maximum range of frequency analysis of 90 KHz.
3.8 Why there is a need for more than one AA filter
As already mentioned, due to the properties of the FFT, to vary the frequency range, you must vary the sampling rate of the waveform.
That way, it's easy to see that you should also reduce the frequency of the AA filter, for the same amount.
Like this, since a vibration analyzer is used in many applications, it is good to have many frequency ranges. Consequently, this may imply that there must be many AA filters.
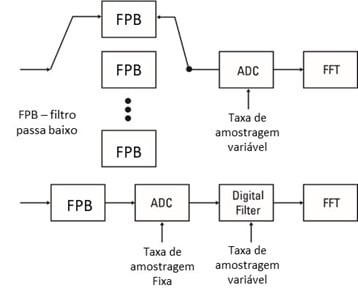
Yet, the solution that is used, by analyzer manufacturers, only has an analog AA filter. actually, this only exists to provide protection in the maximum frequency range of the analyzer.
De facto, for the lowest analysis frequencies, digital filters are used.
3.9 Why digital filters exist
As is obvious, this solution is called digital filtering, because it filters to digitized waveform, with mathematical algorithms.
Like this, what is normal is that in the analyzers, there is only one analog AA filter. As mentioned, it always exists to provide protection in the maximum frequency range.
Figure 3.7 – As mentioned, here you can see the block diagram of analog and digital filtering in an analyzer.
Like this, it has already been seen that for other frequencies a digital filter is used. Like this, each time the frequency range of the spectrum is changed, a digital filter is used, that excludes frequencies that don't matter.
When using digital filtering, the sample rate of the ADC does not have to be changed. De facto, this rate is always the maximum rate corresponding to the maximum frequency of the analyzer.
So how does the digital filter work?
De facto, the digital filter performs a new signal resampling.
Thus, the number of waveform samples is reduced and, at the same time, your sample rate. In consequence, how the sampling rate is reduced, the maximum frequency of the spectrum is reduced.
This means that there is no need to have more than one analog AA filter. De facto, for lower frequencies, the other filters are digital.
3.10 Why a new sampling is performed?
Like this, the digital filter is known as a decimation filter.
This is in fact because the filter reduces the number of samples of the waveform, for the required rate for the desired frequency range.
Like this, it is easy to implement a single digital filter to work across many frequency ranges. This way we avoid the need for several analog filters.
In consequence, all of these factors imply that, the digital filter is much cheaper than the analog filter.