Vibration analyzer 12 – Two-channel functions over time
The specific topic dealt with in a vibration analyzer 12, consists of the functions of two channels in the time domain in a vibration analyzer, how they are carried out how they are carried out.
When it takes place Vibration Analysis, in a vibration analyzer when performing predictive maintenance, to take advantage of the full potential of a vibration analyzer, you need to understand how it works. Therefore, here are presented the concepts of digital signal analysis, currently implemented on an FFT vibration analyzer, from the user's point of view.
We begin by presenting the properties of the Fast Fourier Transform (FFT) on which Vibration Analyzers are based. Then, it shows how these FFT properties can cause some undesirable characteristics in the analysis of the spectrum, like aliasing and breakouts (leakage). Having presented a potential difficulty with the FFT, shows what solutions are used to make vibration analyzers practical tools. The development of this basic knowledge of the characteristics of the FFT makes it simple to obtain good results with a vibration analyzer on a wide range of measurement problems.
Here you can see the range of Vibration analyzers made available by D4VIB.
- What is the relationship between time and frequency
- How sampling and scanning works
- What Aliasing is and what effects it has
- How it is used and what the zoom consists of
- How waveform windows are used
- What are averages for
- What is real-time bandwidth
- What overlay processing is for (“overlap”)
- What is order tracking
- What is envelope analysis
- The two-channel functions in the frequency domain
- What Orbit is for
- What are the functions of a channel in the time domain
- What the Cepstro consists of
- What are the units and scales of the spectrum
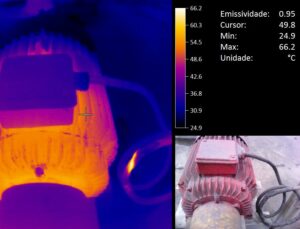
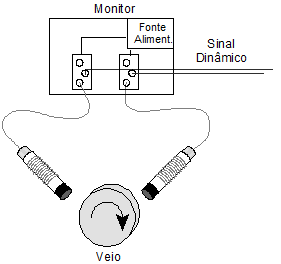
12.1. Vibration monitoring with proximitors on machines with oil film bearings
The time signal provides important and useful information, how they are carried out, this information is limited. In this type of movement, on anti-friction metal bearings, where the oil film dampens vibrations in the bearing housing, the signal in time, supplied by an accelerometer, it is not the most suitable. To monitor this movement, displacement sensors that measure the relative vibration between the shaft and the housing, are more suitable, especially when installed in pairs.
Vibration analyzer 12 – Figure 12.1 Vibration monitoring with proximitors on machines with oil film bearings
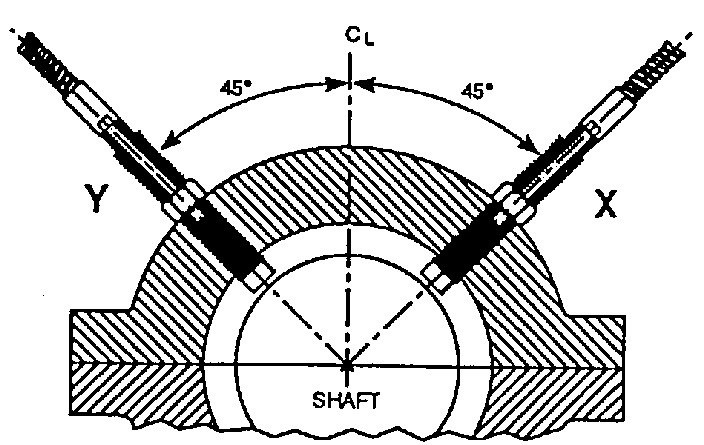
With two relative vibration displacement sensors (proximitors) there are conditions to know the movement of the center of the shaft in this plane. This information can be presented in two individual time signals, respectively to each sensor, more or ideal, is to obtain a graph that represents the two dimensions of the movement of the shaft. This graph is designated by orbit. The orbit represents the path from the center of the shaft in the reading plane of the pair of proximity sensors. The sensors are rigidly mounted on the machine frame, next to the support areas of the shaft (bearings). Like this, the orbit represents the trajectory of the center of the shaft relative to the structure of the machine. Due to the easy interpretation and amount of information that the graph contains, the hourglass, reconciled with a phase indicator, also known as a phase sensor, is an effective graph to understand the physical phenomena that occur on rotating machines.
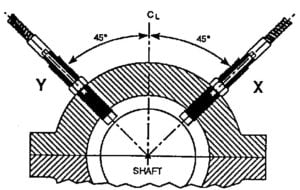
Vibration analyzer 12 – Figure 12.2 - Pair of displacement sensors (proximitors) mounted on an oil film bearing
12.2 Construction of the Orbit in the vibration analyzer
The orbit combines the data present in the waveforms of the pair of proximity sensors, out of phase 90º, to create a graph that displays the movement of the shaft center in two dimensions. In the orbit of the Figure 12.3 the sensors are set at 0 ° and 90 °.
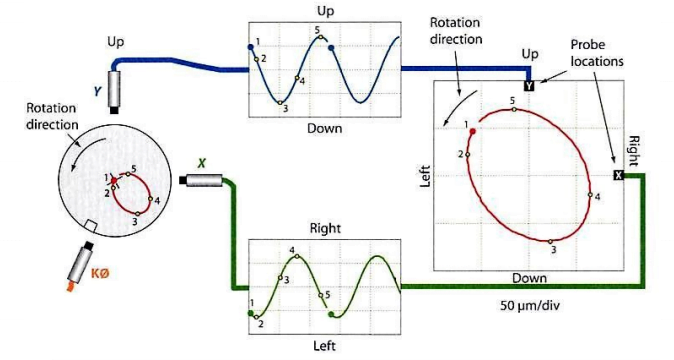
Vibration analyzer 12 – Figure 12.3 – Orbit resulting from the pair of XY displacement sensors in a vibration analyzer
In orbit, a point is defined by a pair of X and Y values, that is obtained through the information contained in the signals in time. The center of the graph is defined by the average of the X and Y values of the two waveforms. An impulse emitted by phase sensor acts as a reference: the black dot shows the location of the center of the shaft when this impulse occurs. To complete the graph, the location of the sensors and the direction of rotation of the shaft are shown in Figure 12.3. Note that the direction of rotation of the shaft cannot be determined from the orbit without additional information. The best way to determine the direction of rotation is to examine the machine. Another option is to use orbits in slow rotation, which act in the direction of the precession movement. Like this, knowing that the machine is in slow rotation, allows to determine the direction of rotation observing the direction of precession. The direction of precession is determined by the space / black point sequence of the orbit of Figure 12.3. The point of maximum amplitude of the time signals corresponds to the minimum distance between the sensor and the shaft surface.
In the figure 12.3 illustrates the progression of the shaft center around its orbit from the point 1 to the 5. The point 1 shows the location of the center of the shaft when the pulse of the phase sensor, that is, when the first vertex of the notch produced in the shaft passes close to the sensor phase sensor. The dots 2 e 4 refer to the furthest and closest point to the X sensor (the minimum and maximum peak in the signal graph at time X). In the same way, The dots 3 e 5 refer to the furthest and closest point to the Y sensor (the minimum and maximum peak in the signal graph at time Y).
Usually, various vibration cycles are represented on the graph. In the figure, a vibration cycle is represented in the signal graph over time, which means that the orbit also has a cycle. The positive peak of the signal over time always represents the closest approximation of the shaft to the associated sensor
12.3 Mounting orientation of the sensors
The mounting directions for the sensors are defined in relation to the reference direction of the machine. The observer will be positioned in the axial direction of the shaft from the driving machine to the driven machine. The locations of the sensors are indicated at the ends of the graphs, which provides a uniform visual reference, regardless of the mounting orientation of the sensors. In the figure 12.4, The orbit is oriented so that, whoever watches her, view as being positioned according to the reference direction, looking along the axis of the machine.
Figure A 12.4 shows two examples of orbits with different orientations in the assembly of the sensors. In both cases, the orbit is the same, only the mounting orientation is different. Note that the indication of the sensors in the graphs represents the mounting position of these.
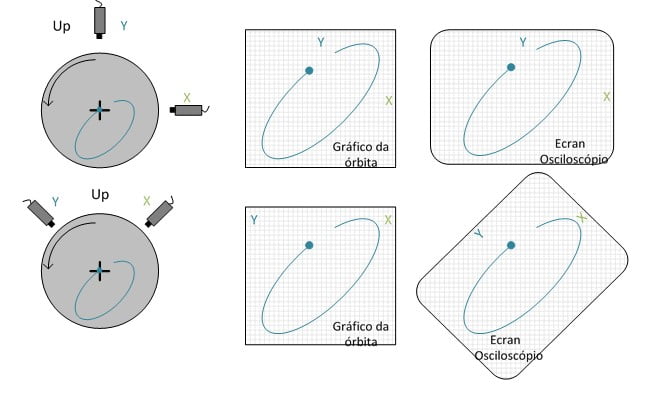
Vibration analyzer 12 – Figure 12.4 – Position of sensors and respective views
On the right side of the Figure 12.4, equivalent orbits from an oscilloscope are present. Because the X and Y axes of the bottom oscilloscope do not correspond to the positions of the mounted sensors, the oscilloscope would have to be physically rotated 45 °, counterclockwise (How does it happen?), in order to display the orbit with the correct orientation. In this orientation, the horizontal and vertical axes of the oscilloscope coincide with the orientations of the sensors. When observing orbits on an oscilloscope, the X and Y axes of this, must comply with the installation instructions for the sensors, or the displayed orbit will not correspond to reality.
The filtered orbits are not built directly from the information indicated by the waveform pair. The time signal collected by the sensors is filtered at a certain frequency and later used for the construction of the filtered orbit.
12.4 The phase and rotation speed benchmark in the vibration analyzer- Phase sensor (keyphasor)
The space / orbit point sequence represents the effect of the phase sensor. This impulse represents an event in time that occurs once per rotation of the shaft. The signal comes from a particular proximity sensor that is placed radially in a different axial position. The impulse of the phase sensor allows you to indicate the location of the center of the shaft at the moment when, the notch produced on the shaft for the purpose, passes through this sensor during rotation. The space / point sequence indicates the direction of time increment.
Figure 12.5 shows a rotating shaft. During the rotation movement, the center of the shaft also moves (precession movement) along a trajectory that will define the orbit. When the first vertex of the notch passes near the phase sensor (position 3 from Figure 12.5), the center of the shaft coincides with the phase sensor point of the orbit.
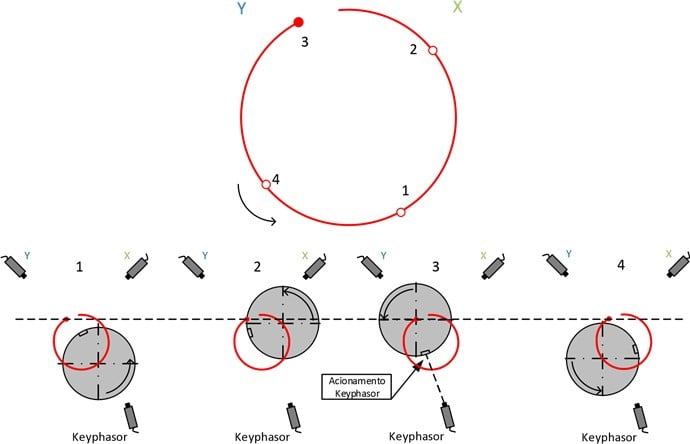
Vibration analyzer 12 – Figure 12.5 – Functioning of phase sensor
At the sign in time, the period between two impulses of the phase sensor represents a rotation of the shaft. In the orbit graph, the shaft moves along the path between two points of the phase sensor, during rotation. The point of phase sensor is added to the graph each time the shaft completes a rotation. If the graph covers information for multiple rotations, will be present, on this graph, the corresponding number of points phase sensor. In filtered orbits the nX the rotation speed, in which n it is an integer, successive points will be inserted in the graph phase sensor, that will overlap each other. The point of phase sensor adds information that is useful for determining the instantaneous direction of movement of the shaft and for estimating the absolute phase, the frequency of vibration in orders of the speed of rotation and, by last, the rotor vibration mode.
12.5 Information present in the Orbits in a vibration analyzer
The clock, especially be endowed with phase sensor, can be used to measure peak-to-peak amplitude in any radial direction, the relative frequency of the vibration or the direction of precession. The orbit profile can provide important clues about the machines' behavior, highlight changes in the response that would have been traditionally unnoticeable, and help identify the location where the problem may occur in relation to the position of the machine components. The orbit displays the path of the shaft relative to the average position, there is no information about the average position of the shaft. To obtain the average position of the shaft, there are other types of graphics.
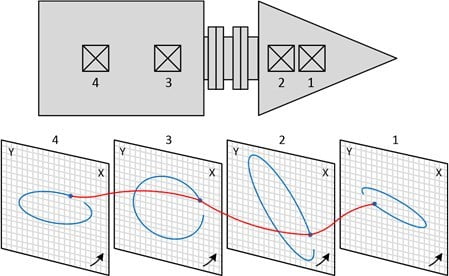
Orbit charts can be created from the same location and at different speeds (transient data), to show the evolution of shaft vibration with increasing speed. On the other hand, orbits can be created from different axial locations and at the same speed, to display the vibration mode of the shaft. The main measurement that can be made in an orbit is the peak-to-peak amplitude (Figure 12.6). There are two fundamental aspects when using this measurement. First, peak-to-peak measurement needs to be done parallel to the sensor's measurement axis. Simply measure vertically or horizontally, in this case, would produce different and incorrect results. Second, peak-to-peak measurement is made between tangents that are also perpendicular to the sensor's measurement axis.
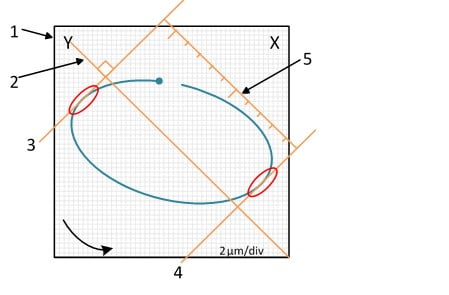
Vibration analyzer 12 – Figure 12.6 – Measurement of the peak-to-peak amplitude of the orbit
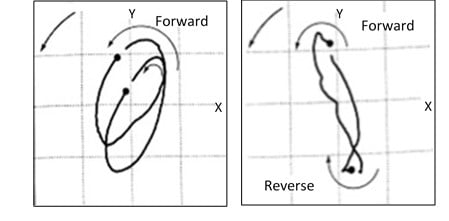
The orbit is used to determine the direction of shaft precession. The point of phase sensor indicates the direction of time increase, sense that will be the precession of the vein. Once determined, the direction of precession can be compared to the direction of rotation to confirm that we are facing precession to face (coinciding direction of rotation and precession) or back (sense of precession contrary to rotation).
In complex orbits, the shaft can be precessed forward for one part and precessed backward for the remainder of the orbit. Notice how the inner loops of the orbits 1 / 2X the rotation speed of the Figure 12.7 keep precession forward, while outer loops show backward precession.
Vibration analyzer 12 – Figure 12.7 – Sense of precession of the orbits
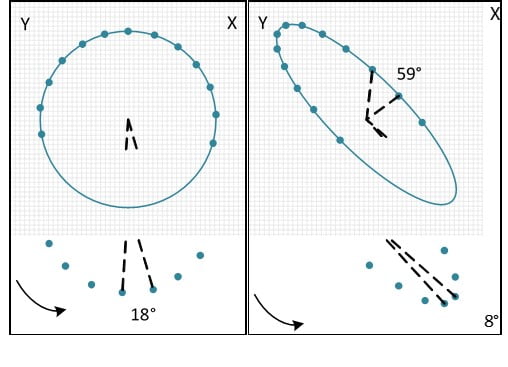
The filtered orbit can be used to estimate the absolute phase of the two components of the signal. This estimate will be more accurate for circular orbits, and less accurate for elliptical orbits (Figure 12.8) due to the constant angular velocity of the circular orbit along its path (equal time intervals and similar angles between points). In elliptical orbits, the angular velocity of the orbit is not constant (equal time intervals, but different angles between points). Since the phase is a measure of time, these variations in angular velocity cause inaccuracies when trying to estimate the phase with respect to each sensor.
Vibration analyzer 12 – Figure 12.8 – Difficulties in reading phase in orbits
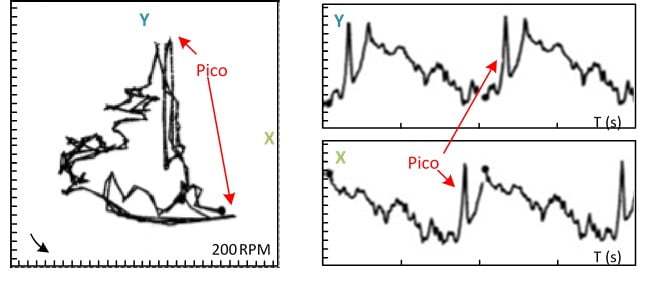
Figure A 12.9 illustrates a set of orbits 1X the speed of rotation at which the points of the phase sensor indicate the location of the center of the shaft, in each measurement plan, the moment the impulse occurs. These points can be connected to each other by a line, in order to obtain an estimate of what the behavior of the shaft will be along its length. The shaft movement occurs at different rates in different parts of the orbit. No additional indications, the location of the shaft is not known at any given time. The impulse of the phase sensor is the solution, providing the reference in time for a point, in particular, in each orbit.
Vibration analyzer 12 – Figure 12.9 – In each orbit, the impulse of phase sensor displays the location of that point on the shaft
12.5 Presentation of the orbit associated with the waveforms of the signal over time in a vibration analyzer
This type of graph combines the orbit with two waveforms of the signal in time. The waveform resulting from the Y reading is displayed above the X, both to the right of the orbit (Figure 12.10). The graph contains information about the direction of rotation, the velocity, the scale used in orbit and the time scale present in the waveforms. The figure is an example of how to use these graphs to find a defect in the shaft surface. This orbit has a profile that reveals the existence of damage to the surface of the shaft. Normally, surface defects are reflected by peaks that point in the direction of the sensors. Waveforms help to clarify the period between these peaks and make it possible to determine the angular location of the damage on the surface.
Vibration analyzer 12 – Figure 12.10 – Orbit associated with Y and X waveforms
Remember that the positive peaks of the waveform represent the passage of the shaft next to the sensor and that, the mounting location of the sensors, is displayed on the orbit graph. The impulse of the phase sensor represents the same instant in all graphs. This combination of graphs makes it possible to correlate the information present in the orbit with the information of the waveforms.