Vibration analyzer 10 – Envelope analysis
The specific topic dealt with in a vibration analyzer 10, consists of the Envelope Analysis in a vibration analyzer.
When it takes place
Vibration Analysis, to take advantage of the full potential of a vibration analyzer, you need to understand how it works. Therefore, here are presented the concepts of digital signal analysis, currently implemented on an FFT vibration analyzer, from the user's point of view within a program of
predictive maintenance.
We begin by presenting the properties of the Fast Fourier Transform (FFT) on which Vibration Analyzers are based. Then, it shows how these FFT properties can cause some undesirable characteristics in the analysis of the spectrum, like aliasing and breakouts (leakage). Having presented a potential difficulty with the FFT, shows what solutions are used to make vibration analyzers practical tools. The development of this basic knowledge of the characteristics of the FFT makes it simple to obtain good results with a vibration analyzer on a wide range of measurement problems.
Here you can see the range of
Vibration analyzers made available by D4VIB.
- What is the relationship between time and frequency
- How sampling and scanning works
- What Aliasing is and what effects it has
- How it is used and what the zoom consists of
- How waveform windows are used
- What are averages for
- What is real-time bandwidth
- What overlay processing is for (“overlap”)
- What is order tracking
- What is envelope analysis
- The two-channel functions in the frequency domain
- What Orbit is for
- What are the functions of a channel in the time domain
- What the Cepstro consists of
- What are the units and scales of the spectrum
10 –Vibration and envelope analyzer
The envelope analysis is, currently, the tool par excellence, for detecting impacts such as those generated in bearing failures with a vibration analyzer. It has also become essential to diagnose all mechanical problems that can generate impacts, such as gears in poor condition, days off, desapertos, etc.
Originally, when it was developed did not have the ability to measure, with accuracy, the level of acceleration generated by mechanical impacts, but, since the nineties, with the development of detection technology impact peaks, this limitation is exceeded.
The envelope with vibration analysis techniques have had various commercial designations and, namely:
• Peak Vue (Emerson/CSI);
• Espectro de Spike Energy (IRD/ENTEK/Rockwell Automation);
• Demodulation;
• Envelope;
• Etc.
However despite the different names and how to implement, all continue to provide envelope analysis versions.
10.1 The frequency spectrum of waveforms generated by impacts
In this article, the representation in the frequency spectrum of a sinusoidal vibration has been mentioned many times. When it comes to vibrations generated by impacts, of very short duration, vibration is not of the sinusoidal type and new challenges arise.
In the following figure you can see different types of waveforms and respective frequency spectra as measured by a vibration analyzer.
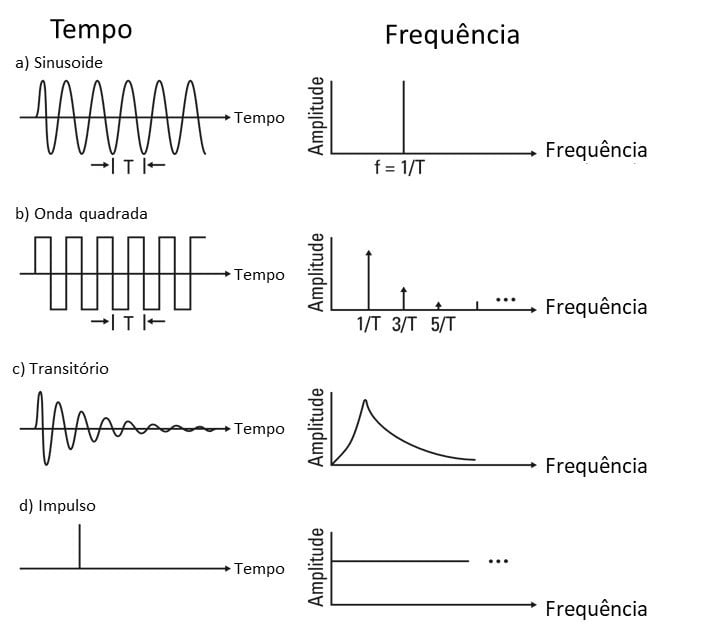
Vibration analyzer 10 – Figure 10.1 – Waveforms and their spectrum
The frequency spectrum of an impulse, similar to that generated by an impact, it's a flat line, low amplitude that spreads across all frequencies.
10.2 The technical challenges in measuring vibrations generated by impacts with a vibration analyzer
There are two technical challenges in
vibration measurement generated by impacts with a vibration analyzer:
• Separate vibrations generated by very low level impacts from other vibrations generated on a machine;
• Quantify, with accuracy, the level of vibrations generated by impacts.
10.2.1 The separation of vibrations generated by very low level impacts from other vibrations generated in a machine;
When it comes to measuring vibrations on a machine, we are often interested in detecting very low level impacts in the presence of other high amplitude vibrations on a machine.. This is the situation you face when trying to detect the first symptoms of a bearing failure..
If it is possible to separate the vibrations from the impacts of the other vibrations on the machine, it will be much simpler to follow its growth, as shown in Figure.
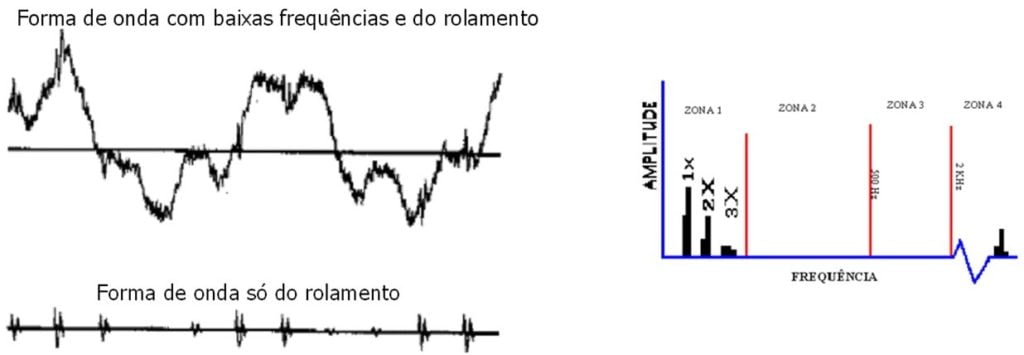
Vibration analyzer 10 – Figure 10.2 – The need to separate vibrations from impacts from other vibrations in machines
The figure below shows the vibrations generated by the small impacts of the first phase of bearing failures in the frequency spectrum..
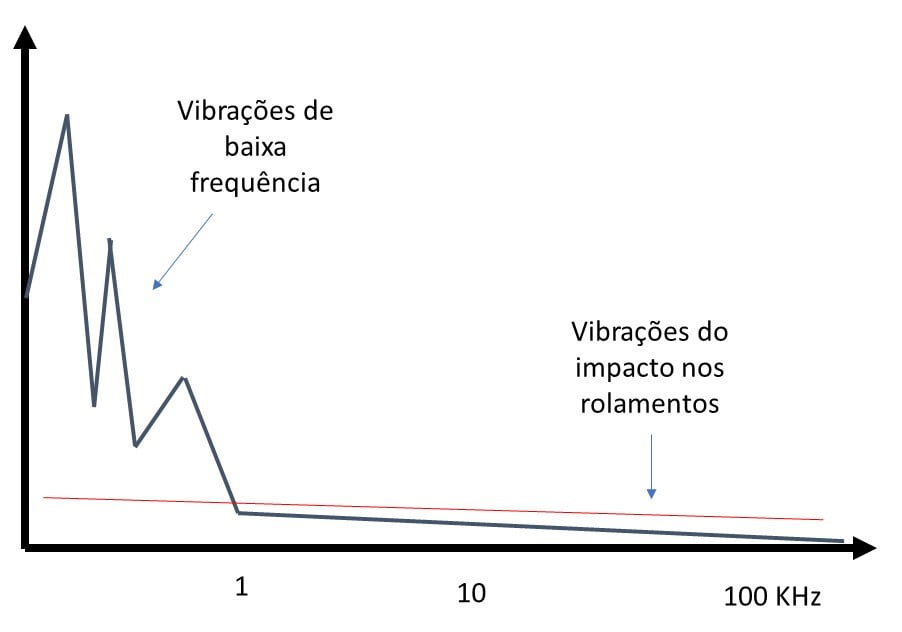
Vibration analyzer 10 – Figure 10.3 – Typical frequency spectrum scheme of a machine with bearings in the beginning of degradation
As the vibrations of degrading bearings, in its early stages, arise especially in acceleration, at high frequencies, it is possible to separate / enhance the vibrations of the impacts, by using a high pass filter of the vibrations measures. In this way it is possible to separate the vibrations from the bearing impacts from the other vibrations of the machine.
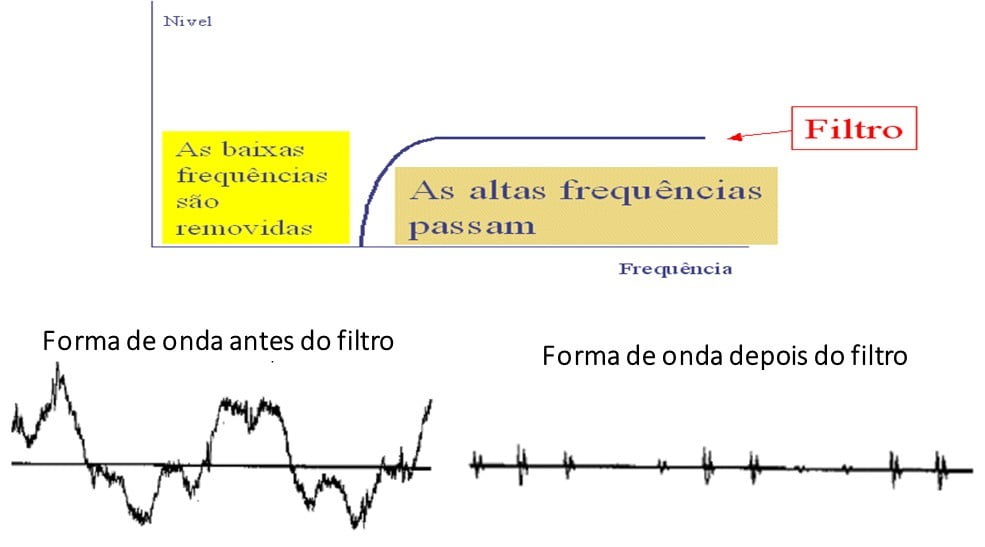
Vibration analyzer 10 – Figure 10.4 Vibration elimination at low frequencies – introduction of high pass filter
This filtering is the first operation of envelope vibration analysis..
10.2.2 The quantification, with accuracy, the level of vibrations generated by impacts
Behind (in 3), the phenomenon of “aliasing” and the sampling rate required to measure the level of, with accuracy, of the level of a sinusoid in the frequency spectrum.
Imagine now that in order to see the characteristic frequencies of a bearing, you want to see a spectrum up to 1 KHz. As seen above, the waveform sample rate will be 2,56 times the Fmax of the spectrum ie 2,56 KHz. The time interval between each sample is 1/ 2560 seconds ie 0,4 mseg. If the duration of the impact is less than this time, the level of impact will not be adequately measured, as can be seen in the figure below.
Vibration analyzer 10 – Figure 10.5 Inadequate waveform sampling rate to characterize the vibration level generated by an impact
It follows that the fixed relationship between sampling in time and frequency range, intrinsic mathematical function of Fourier transform, obtained with the FFT spectrum, prevents obtaining simultaneously:
• High sampling that allows us to adequately measure peak impact levels;
• High resolution in the frequency spectrum that makes it possible to clearly identify the characteristic frequencies of bearing defects.
The solution to this question is to make the waveform sampling rate independent for detecting peak sampling impact peaks in order to obtain the FFT spectrum..
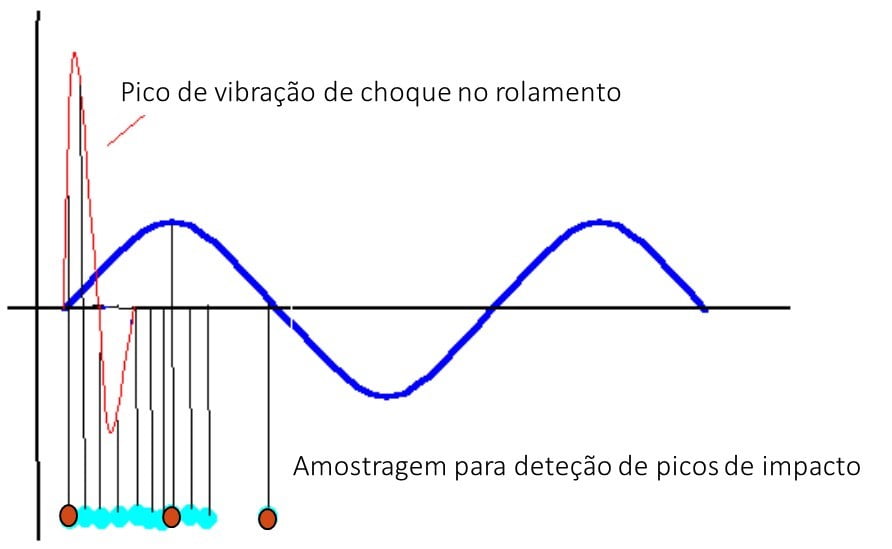
Vibration analyzer 10 – Figure 10.6 Appropriate waveform sampling rate to characterize the level of vibration generated by an impact
As shown in the figure, the sampling rate, adequate to characterize the level of vibrations generated by impacts is much higher than that needed to characterize the level of a sinusoidal vibration.
10.3 – The characterization of the repetition rate of impacts on bearings with envelope analysis
To meet shock repetition period of the envelope analysis rectifies the waveform before performing the FFT spectrum.
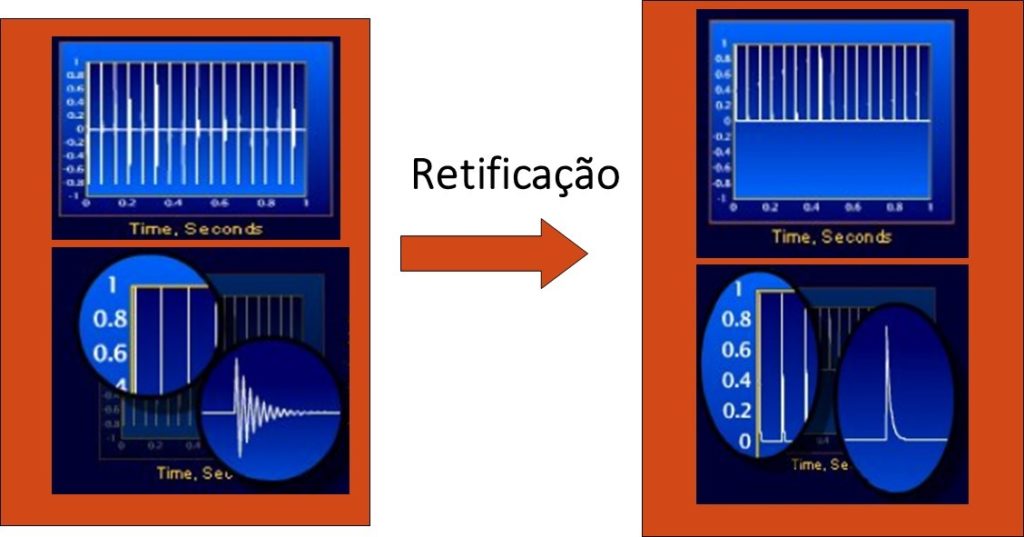
Vibration analyzer 10 – Figure 10.7 - The correction waveform
10.4 - Obtaining the frequency spectrum of the traditional envelope
The frequency of vibration analysis is performed on the rectified waveform, There was thus having the following diagram of vibration analysis blocks with envelope.
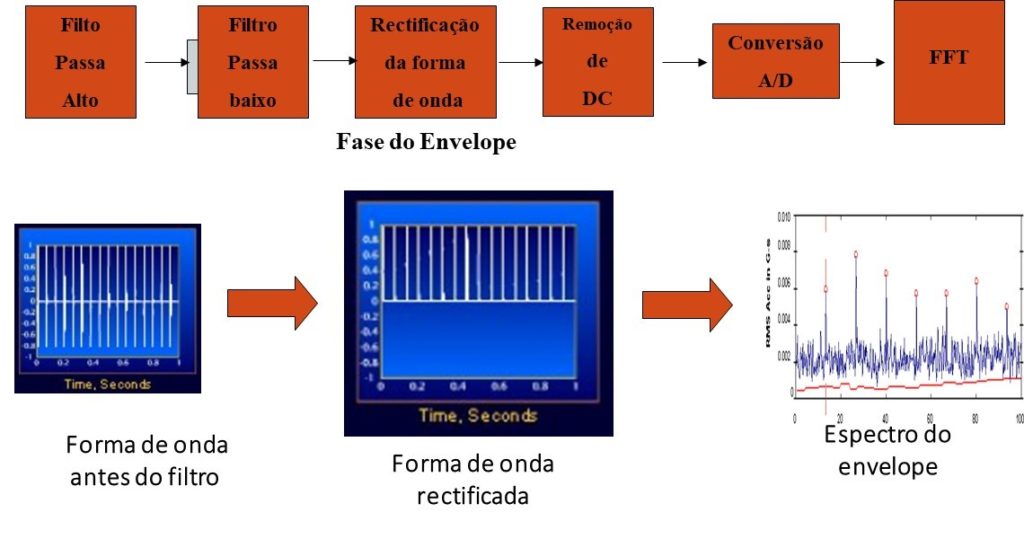
Vibration analyzer 10 – Figure 10.8 – Schematic of the implementation of traditional envelope vibration analysis
This way of implementing the FFT spectrum does not adequately characterize the level of the components of the rectified waveform and the frequency spectrum.
10.5 - The correct measurement of peak amplitude envelope waveform – digital detection impact peaks
The most recent way to measure the peak amplitude of the envelope is to first sample the waveform at a very high frequency (for example 100 KHz), regardless of the maximum spectrum frequency, to ensure that properly measure the extent of the impact of peaks.
These samples then serve to reconstruct a waveform that will serve to build the frequency spectrum. This reconstructed waveform retains May each sample value of all samples that gave rise to. This technique is used by ADASH, among others.
Below follows a block diagram thereby envelope analysis.
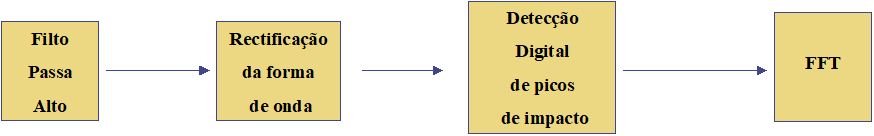
Vibration analyzer 10 – Figure 10.9 – Schematic of the implementation of envelope vibration analysis with impact peak detection
This approach to measuring the amplitude of the peaks in the waveform and the components of the spectrum gives correct values..
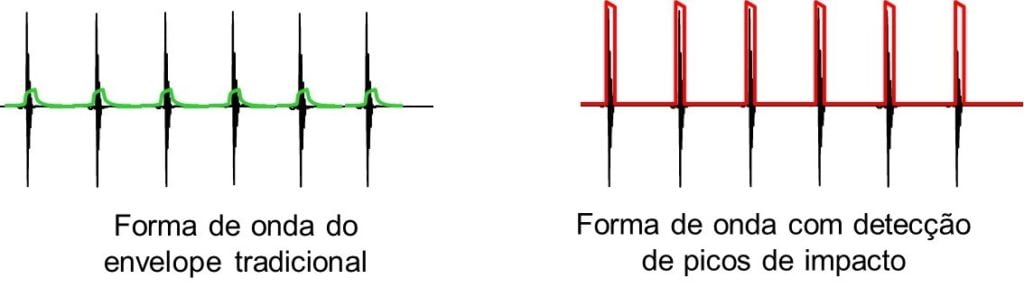
Vibration analyzer 10 – Figure 10.10 - Rectification of the waveform with digital detection impact peaks
10.6 – Advantages of digital detection of impact peaks
The advantages of digital detection of impact in peak envelope with vibration analysis arise in different circumstances.
a) Machines running at low speed
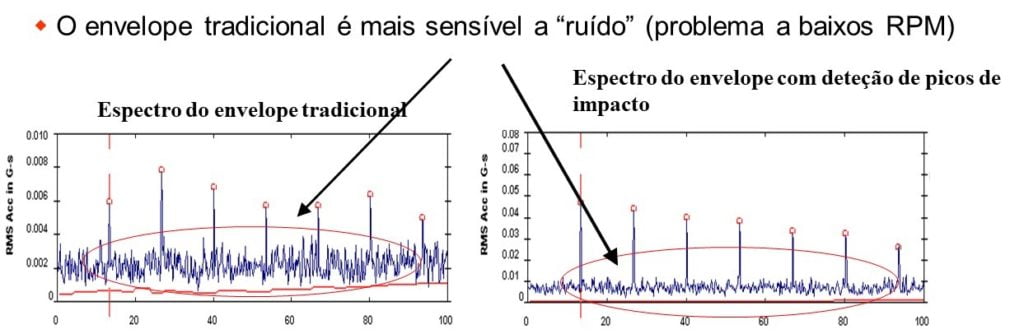
Vibration analyzer 10 – Figure 10.11 – Envelope analysis with digital impact peak detection has less noise
B) Measuring correct amplitudes
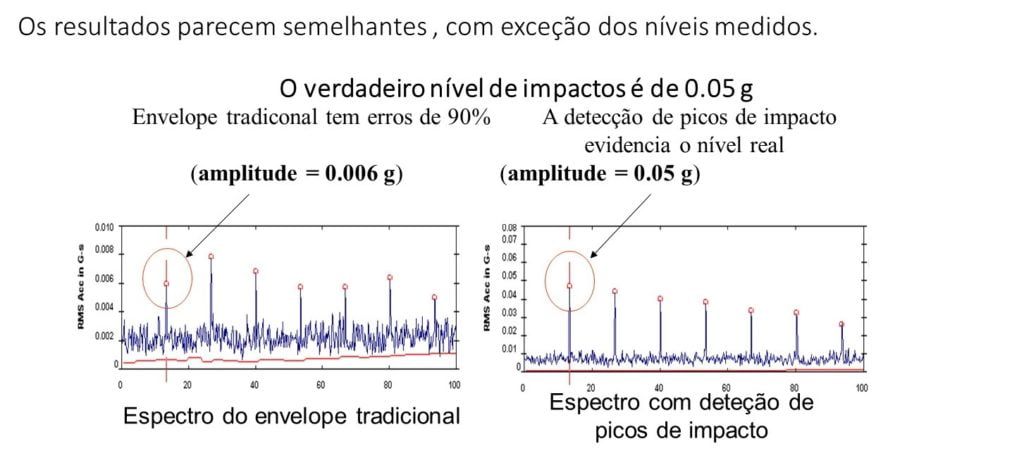
Vibration analyzer 10 – Figure 10.12 - The envelope detection, with digital impact peak detection, measure the correct amplitudes
ç) Waveform display
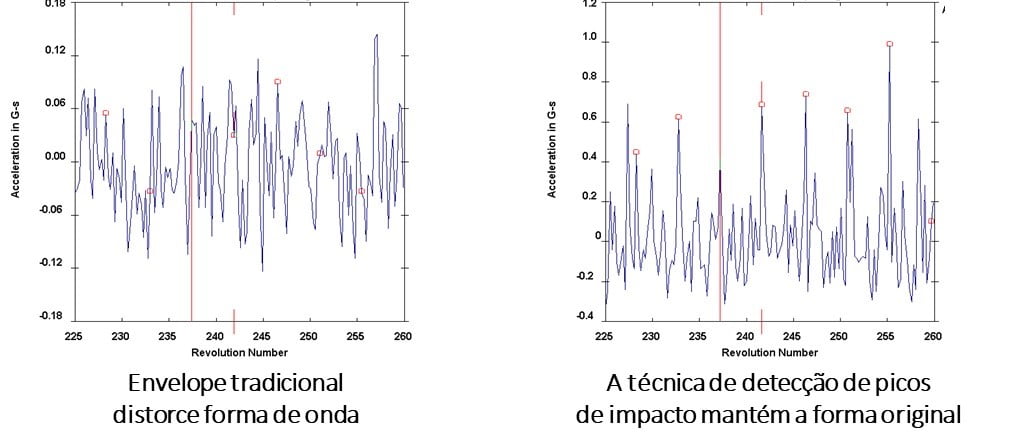
Vibration analyzer 10 – Figure 10.13 – Traditional envelope distorts the waveform
Vibration analysis with envelope analysis with impact peak detection allows the physical interpretation of the phenomena that give rise to the waveform.
d) Machinery at high rotational speeds
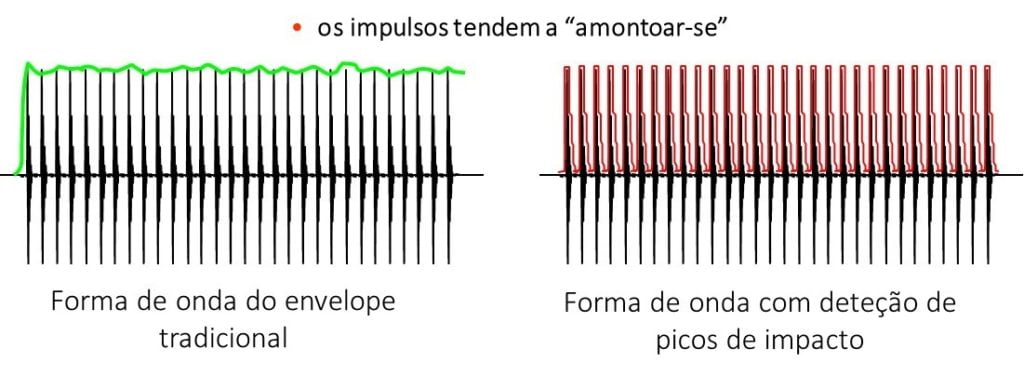
Vibration analyzer 10 – Figure 10.14 - With traditional envelope impulses "Join".