Then, on vibration analyzer 4, we introduce the zoom theme. actually, this article is part of a series of articles that explain how a vibration analyzer works.
De facto, when we do Vibration Analysis, we need to understand how a parser works when performing measuring vibrations. Therefore, here we present the concepts of digital signal analysis, implemented in an FFT analyzer. In order to be easy to understand, we always present them from the user's point of view, in a vibration analyzer when performing predictive maintenance.
Then, on vibration analyzer 4, no link, we can see a range of Vibration analyzers provided by D4VIB.
Then, we present the content of this series of articles.
To begin, suppose you want to measure a small level frequency component, when it is very close to a much larger one. For example, take the case of a side band around a gearing frequency. In the same way, we may want to distinguish between network frequency vibration and shaft imbalance in the spectrum of an asynchronous electric motor.
De facto, remember what was said about the FFT properties. As it is known, our frequency resolution is limited to the maximum frequency divided by the number of lines in the spectrum.
For example, it is known that, for example, to separate two lines of 60 Hz, in a spectrum until 20 kHz, we must have 333 lines in the spectrum. Yet, two or three times as many lines would be needed, To measure, with accuracy, the side bands.
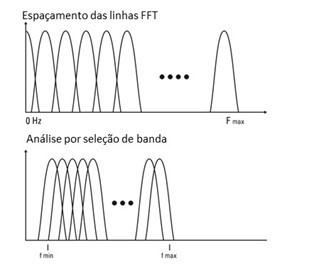
Thus, a way to address this problem, is to concentrate the lines, in the frequency range of interest.
That way, if we select the minimum frequency, as well as the maximum frequency of our spectrum, we can “enlarge” for a high resolution Zoom, of the range concerned.
It should be noted that this way of increasing the resolution, it's called “Zoom”.
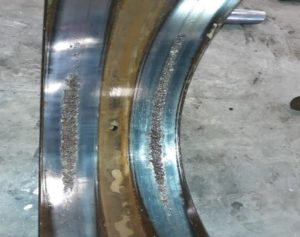
Figure 4.1 As stated, here we see the use of high resolution measurements, with Zoom, a vibration analyzer
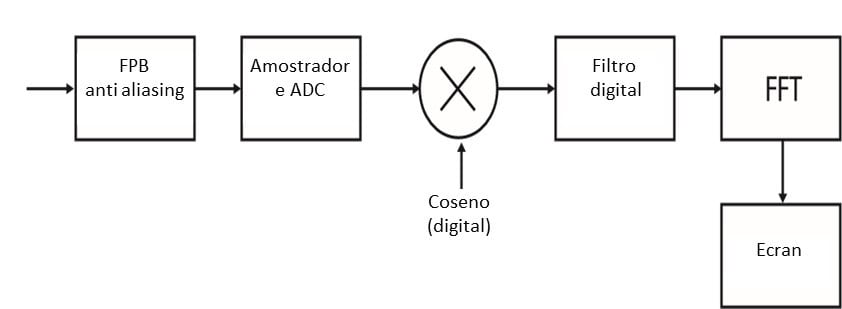
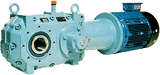
Then, we see the block diagram of the Zoom functionality , a vibration analyzer.
Figure 4.2 – Like this, this figure shows the block diagram of the vibration analyzer, for the implementation of Zoom
In order to see a presentation on this topic, in Vibration Analyzer 4, click here.